. 2007 Jul;3(7):e110.
doi: 10.1371/journal.pgen.0030110.

DNA damage, homology-directed repair, and DNA methylation

Affiliations

DNA damage, homology-directed repair, and DNA methylation

Concetta Cuozzo et al. PLoS Genet. 2007 Jul.

Erratum in

  • Correction: DNA Damage, Homology-Directed Repair, and DNA Methylation.
    Cuozzo C, Porcellini A, Angrisano T, Morano A, Lee B, Pardo AD, Messina S, Iuliano R, Fusco A, Santillo MR, Muller MT, Chiariotti L, Gottesman ME, Avvedimento EV. Cuozzo C, et al. PLoS Genet. 2017 Feb 10;13(2):e1006605. doi: 10.1371/journal.pgen.1006605. eCollection 2017 Feb. PLoS Genet. 2017. PMID: 28187196 Free PMC article.

Abstract

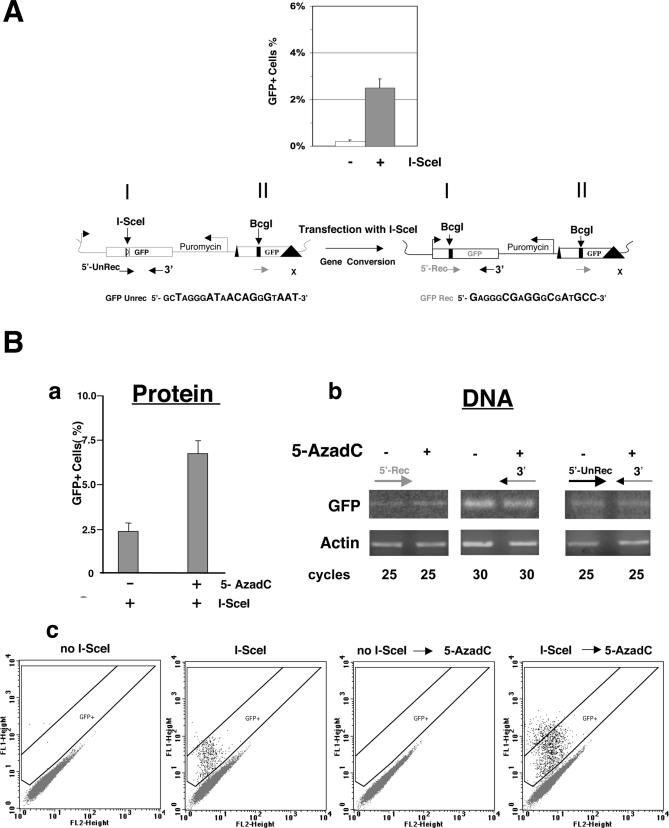
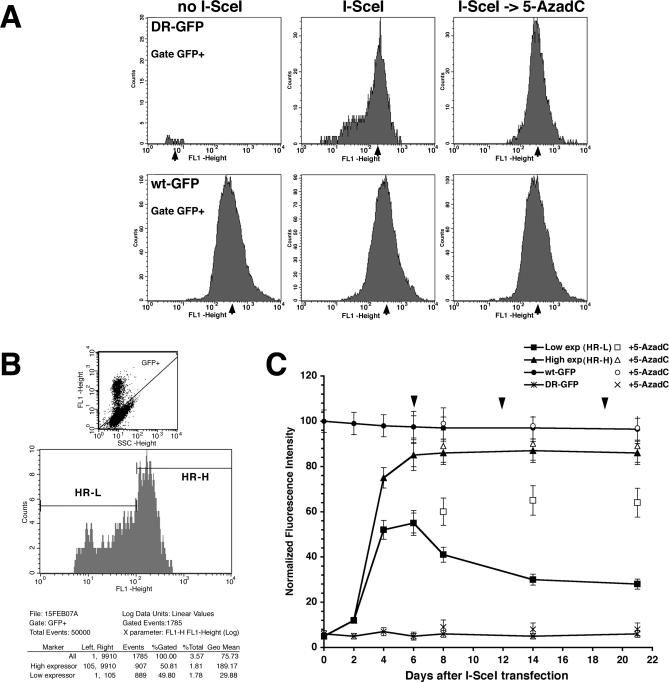
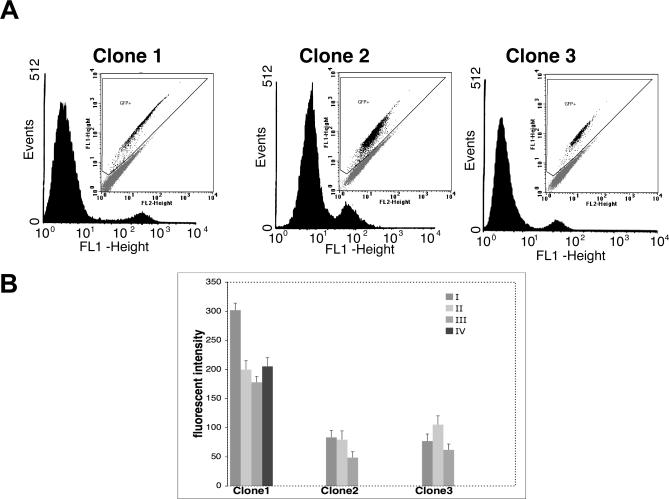
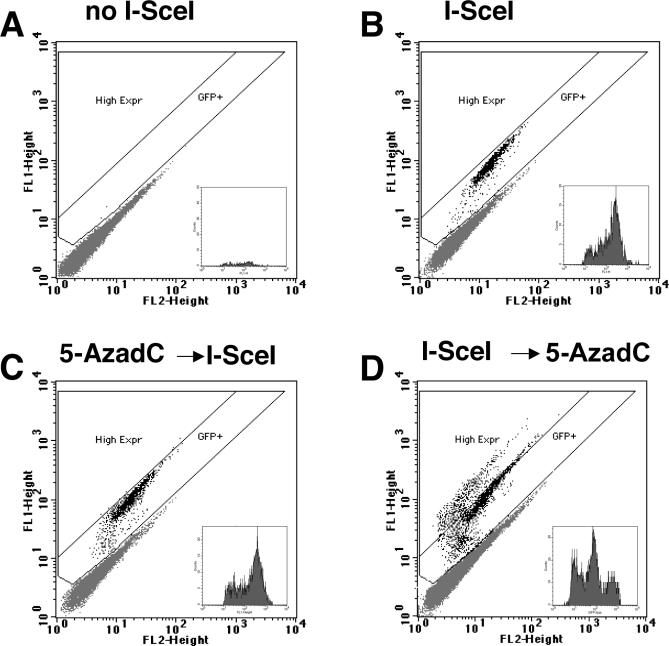
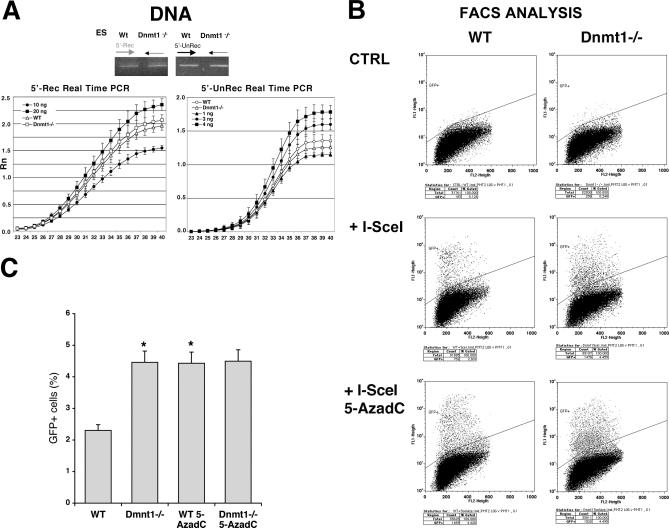
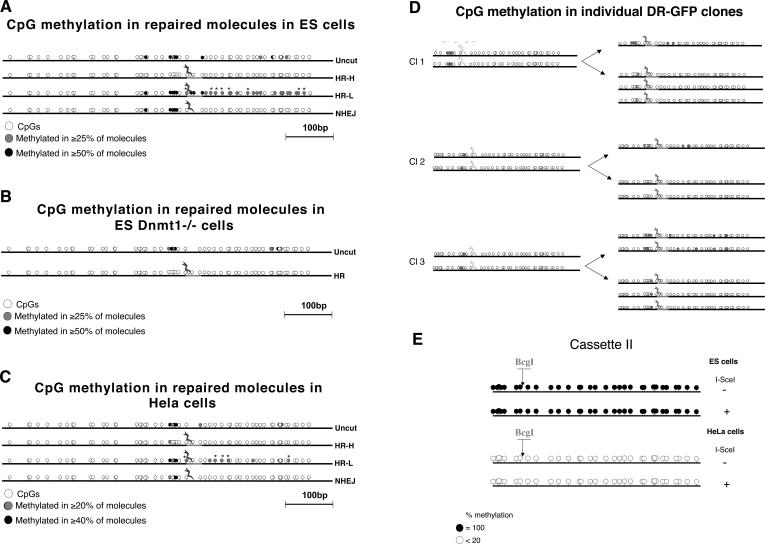
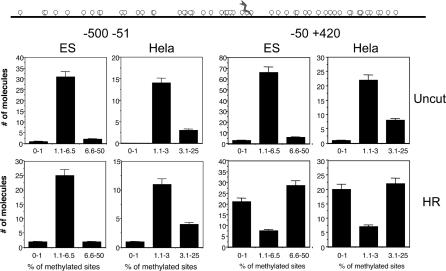
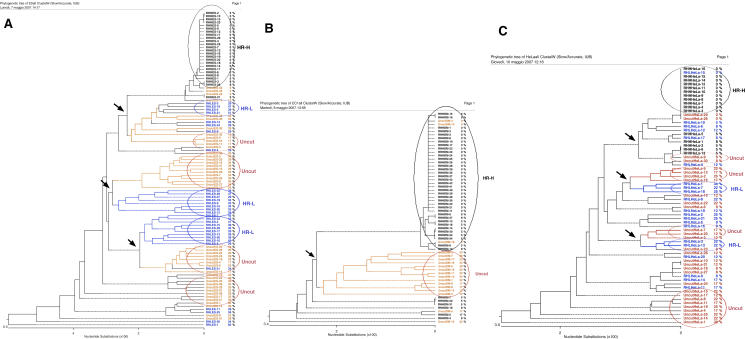
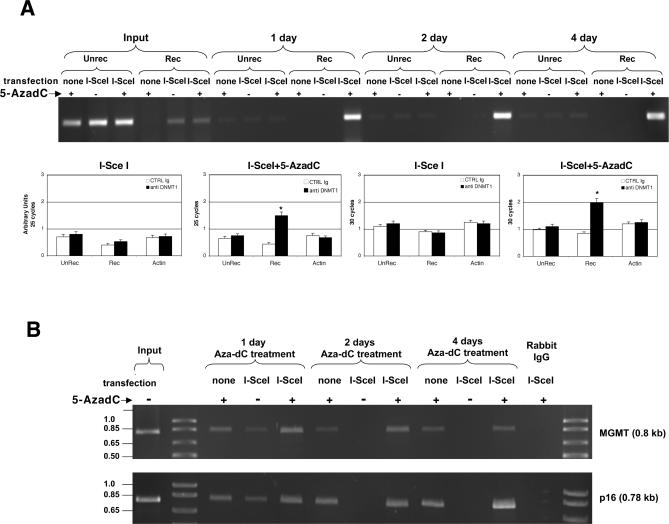
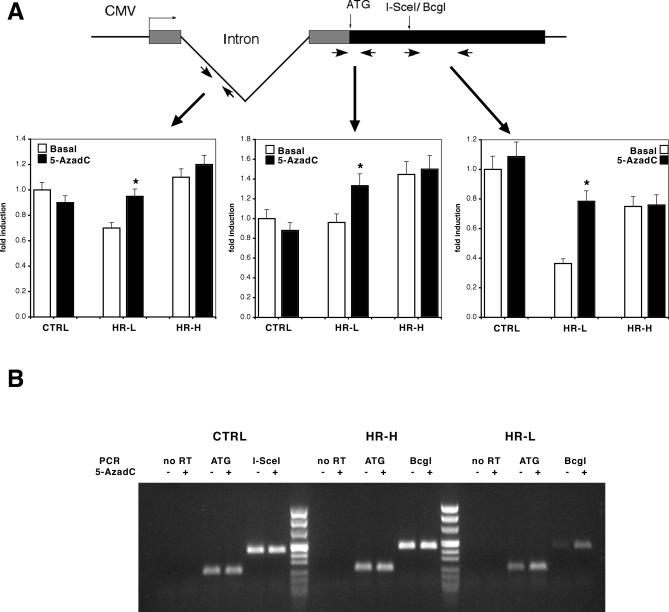
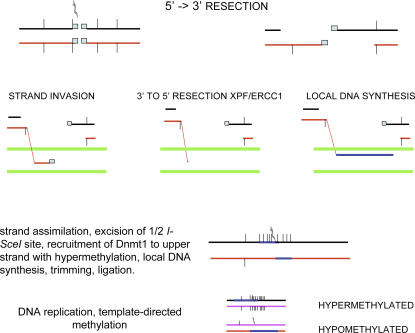
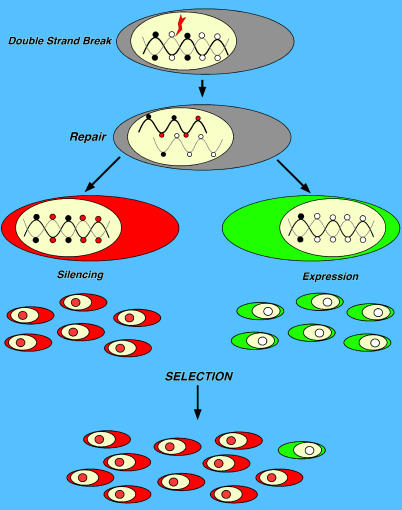
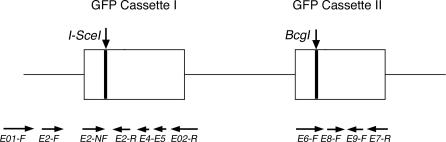
To explore the link between DNA damage and gene silencing, we induced a DNA double-strand break in the genome of Hela or mouse embryonic stem (ES) cells using I-SceI restriction endonuclease. The I-SceI site lies within one copy of two inactivated tandem repeated green fluorescent protein (GFP) genes (DR-GFP). A total of 2%-4% of the cells generated a functional GFP by homology-directed repair (HR) and gene conversion. However, approximately 50% of these recombinants expressed GFP poorly. Silencing was rapid and associated with HR and DNA methylation of the recombinant gene, since it was prevented in Hela cells by 5-aza-2'-deoxycytidine. ES cells deficient in DNA methyl transferase 1 yielded as many recombinants as wild-type cells, but most of these recombinants expressed GFP robustly. Half of the HR DNA molecules were de novo methylated, principally downstream to the double-strand break, and half were undermethylated relative to the uncut DNA. Methylation of the repaired gene was independent of the methylation status of the converting template. The methylation pattern of recombinant molecules derived from pools of cells carrying DR-GFP at different loci, or from an individual clone carrying DR-GFP at a single locus, was comparable. ClustalW analysis of the sequenced GFP molecules in Hela and ES cells distinguished recombinant and nonrecombinant DNA solely on the basis of their methylation profile and indicated that HR superimposed novel methylation profiles on top of the old patterns. Chromatin immunoprecipitation and RNA analysis revealed that DNA methyl transferase 1 was bound specifically to HR GFP DNA and that methylation of the repaired segment contributed to the silencing of GFP expression. Taken together, our data support a mechanistic link between HR and DNA methylation and suggest that DNA methylation in eukaryotes marks homologous recombined segments.


Conflict of interest statement

Competing interests. The authors have declared that no competing interests exist.

Figures

Figure 1
Figure 1. DNA Methylation and Recombination
(A) In the recombination assay primers for PCR and RT-PCR amplification were: (1) 5′-unrec (unrecombinant) centered on the I-SceI site, present only in cassette I and (2) 5′-rec (recombinant) centered in the BcgI site present only in the converted GFP or in cassette II. The 3′ end primer (3′) is located in cassette I in a sequence deleted in cassette II (X). The 5′-rec primer can pair with the 3′ primer only after its reconstitution in the 5′ cassette by gene conversion. The sequence of the 5′ primers is indicated with the distinguishing bases in capital letters. Stable Hela cells containing the DR-GFP plasmid were transiently transfected with I-SceI and pSVβGal (Promega) expression vectors as described in Materials and Methods. After 3 d, GFP cells were scored by FACS. The histogram shows data from three experiments. Transfection efficiency in these three experiments was 70% ± 5%. (B) Inhibition of methylation reveals silenced recombinants. Hela cells carrying the DR-GFP plasmid were transfected with I-SceI and PSVßGal expression vectors and treated with 5 μM 5-AzadC 48 h posttransfection, as described in Materials and Methods. (a) GFP+ cells were analyzed by FACS. The ordinate shows the fraction of GFP+ cells over total cells transfected. The efficiency of transfection was 70% +/− 5%. To determine the effect of 5-AzadC on GFP fluorescence, we compared the percentage of GFP+ cells before and after 5-AzadC treatment in six experiments (three in duplicate) with a nonparametric matched pairs test, such as the Wilcoxon sign-rank (p < 0.016). (b) For the DNA analysis GFP clones were analyzed by PCR with the primers indicated in Figure 1A. The results shown were derived from DNA of I-SceI treated cells (see Materials and Methods). (c) The cells were treated with 5-AzadC 48 h after transfection as described in Materials and Methods and analyzed by FACS. Treatment with 5-AzadC after I-SceI transfection significantly increased the number and the intensity of fluorescence of GFP+ cells, while 5-AzadC alone was ineffective. The area indicated as “GFP+” includes 95% of GFP-expressing cells after I-SceI transfection.
Figure 2
Figure 2. GFP Silencing in Recombinant Clones
Hela cells carrying the DR-GFP or wild-type GFP plasmids were transfected with I-SceI and pSVβGal expression vectors, as described in Materials and Methods. (A) Shown is the fluorescence analysis of cell lines stably expressing wild-type GFP. Treatment with 5-AzadC was carried out as described in Figure 1. The cells were analyzed 7 d following 5-AzadC treatment. The GFP+ gate includes 95% of GFP-expressing cells. The mean fluorescence (arrow) and the % of GFP+ cells were: (1) DR-GFP (no-I-SceI) 7.4 and 0.4 %; (I-SceI) 203.56 and 4.7%; and (I-SceI+ 5-AzadC) 335.31 and 7.6%, respectively and (2) wild-type GFP (no-I-SceI) 357.51 and 95.4 %; (I-SceI) 361.12 and 96.2%; and (I-SceI+ 5-AzadC) 389.68 and 89.6%, respectively. (B) Hela cells carrying the DR-GFP plasmid were transfected with I-SceI and pSVβGal as indicated in Figure 1 . GFP+ cells were sorted by FACS and divided in two pools 4 d after transfection: HR-L and HR-H GFP expressors. The upper panel shows the gate used to select GFP+ cells. The lower panel shows only GFP+ cells and the gates used for sorting HR-L and HR-H. (C) GFP fluorescence in the mass culture was monitored by FACS before transfection and 2 d following transfection. Sorted cells were monitored at 4, 6, 8, 14, and 21 d after transfection. Parallel cultures at 6, 12, and 19 d posttransfection were treated for 24 h with 5-AzadC (arrows). 5-AzadC was washed away and GFP fluorescence was determined 24 h later. DR-GFP and wild-type GFP represent cell lines derived from DR-GFP pools transfected with pSVβGal plasmid or from a stable line expressing the wild-type GFP gene, respectively.
Figure 3
Figure 3. Recombination in Individual DR-GFP Clones
Single clones were isolated from pooled cultures of Hela carrying inactive copies of DR-GFP. The three clones analyzed indicated as 1, 2, and 3 contained a single insertion with one or four copies of DR-GFP by Southern blot and qPCR (Figure S2). These clones were transfected in several independent experiments with I-SceI and pSVβGal vectors and scored for GFP+ cells. (A) Shown is FACS analysis of three clones 72 h after I-SceI transfection. The ordinate shows the number of cells and the abscissa the intensity of the fluorescence, respectively. The inset shows the dot plot of the bivariate analysis. (B) The experiment illustrated in (A) was repeated several times, and the mean of intensity of fluorescence of GFP+ cells is shown in the histogram. The roman numerals indicate an individual experiment.
Figure 4
Figure 4. DNA Methylation Is Induced by I-SceI Cleavage/Recombination
Dot plots of GFP expression in clone 3 after I-SceI transfection are presented. The insets show the mean of fluorescence intensity versus number of GFP+ cells. (A) Cells transfected with a control plasmid (pSVβGal) are shown. (B) Cells transfected with I-SceI are shown. (C) Cells treated with 5-AzadC 48 h before I-SceI transfection are shown. (D) Cells transfected with I-SceI and treated with 5-AzadC 48 h later are shown. All FACS analyses were performed 5 d after transfection. The effects of 5-AzadC were analyzed also at 2–4 and 6 d after transfection, and the results were similar. The efficiency of transfection was 70% ± 10%. Experiments with transfection efficiency lower than 70% were excluded from the analysis.
Figure 5
Figure 5. Dnmt1 Inhibits the Expression of Recombinant GFP Genes
Wild-type or Dnmt1−/− ES cells carrying DR-GFP were transfected with the I-SceI expression vector and PSVbGal, grown 4 d, and analyzed for GFP recombination and expression. (A) Genomic DNA from the two cell lines was PCR-amplified with nonrecombinant (5′-unrec) and recombinant (5′-rec) primers. The specificity of the products and the linearity of the reactions were controlled as described in Materials and Methods. qPCR of the same samples was carried out as described in Materials and Methods. (B) FACS analysis of cells transfected with I-SceI is shown. The gating of GFP+ cells was created to exclude up the 99.5% of wild-type untransfected ES cells. The same gating applied to Dnmt1−/− cells shows a significant increase in the population expressing GFP. Following I-SceI transfection, Dnmt1−/− cells were treated with 5-AzadC as described in Materials and Methods. Treatment with 5-AzadC increased the fraction of cells expressing GFP in wild-type ES but did not enhance the expression of GFP in the Dnmt1−/− cells (C) The histogram showing the fraction of GFP+ cells derived from three experiments is shown. To obtain reliable values of differential GFP fluorescence in ES and Dnmt1−/− cells, we compared the percentage of GFP+ cells, normalized for the transfection efficiency in six experiments (three in duplicate), with the Wilcoxon Kruskal-Wallis Test, *, p < 0.012 versus wild type.
Figure 6
Figure 6. DNA Methylation in Repaired DNA Molecules
(A) CpG methylation in repaired molecules from ES cells is shown. DNA molecules derived from pooled ES DR-GFP cultures transfected with the I-SceI expression vector or a control plasmid were subjected to bisulfite analysis (Materials and Methods). The number of molecules in each class was as follows: (1) uncut, 40 from cells transfected with control plasmid; (2) HR-H, 25 homologous recombinant molecules from high expressor cells sorted by FACS (23) or picked randomly from mass culture; (3) HR-L, 30 recombinant molecules from low expressor cells sorted by FACS (28) or picked randomly from mass cultures; (4) molecules rearranged at the I-SceI site (NHEJ). The frequency (%) of each class was derived from several independent experiments with mass culture and fluorescent-sorted cells. HR-H 3 ± 0.5; HL 3 ± 1; NHEJ 2 ± 0.3. All CpGs (white circles) flanking the I-SceI site are shown. Gray circles, CpGs methylated in ≥25% of molecules; black circles, CpGs methylated in ≥50% of molecules. (B) CpG methylation in repaired molecules in ES Dnmt1−/− cells is shown. DNA molecules were isolated from ES Dnmt1−/− cells carrying DR-GFP, 16 from control cells and 40 from cells exposed to I-SceI. The frequency of GFP+ cells was 5 ± 1. (C) CpG methylation in repaired molecules from Hela cells is shown. DNA molecules, derived from pooled Hela DR-GFP cultures transfected with the I-SceI expression vector or a control plasmid, were subjected to bisulfite analysis (Materials and Methods). The number of molecules in each class was as follows: (1) 25 molecules from cells transfected with control plasmid; (2) 20 recombinant molecules from low expressor cells sorted by FACS; (3) 15 recombinant molecules from high expressor cells sorted by FACS; (4) six molecules rearranged at the I-SceI site (NHEJ). The frequency (%) of each class was derived from several independent experiments with mass culture and fluorescence sorted cells. HR-H 2 + 0.5; HR-L 2 + 1; NHEJ 2 + 0.4. All CpGs (white circles) flanking the I–SceI site are shown. Gray circles, molecules methylated in ≥20% of molecules; black circles, molecules methylated in ≥40% of molecules. (D) CpG methylation in repaired molecules derived from individual DR-GFP clones is shown. DNA molecules were derived from clones 1, 2, and 3 of Figure 2. DNA was isolated and subjected to bisulfite analysis (Materials and Methods). Shown on the left are nonrecombinant molecules amplified with the 5′-unrec primer (see Figure 1). Shown on the right are recombinant DNA molecules isolated from cells transfected for 4 d with the I-SceI expression vector and selected for GFP expression. The arrows indicate hypermethylated DNA from clones expressing GFP at low levels and hypomethylated DNA from high GFP expressors. (E) Methylation of GFP cassette II is not influenced by recombination. DNA methylation pattern of cassette II in Hela DR-GFP (25 molecules) and ES DR-GFP (30 molecules) cells after transfection with I-SceI or before transfection (seven molecules) is shown. The methylation pattern of cassette II was identical in FACS sorted ES or Hela cells. The molecules analyzed both in ES and Hela cells derived from at least five independent bisulfite reactions and ten independent PCRs for each group: (1) PSVβGal transfected cells; (2) GFP- and (3) GFP+ high, and (4) low expressors from I-SceI transfected cells.
Figure 7
Figure 7. Distribution of Methylated CpGs before and after DSB Repair by Homologous Recombination
Statistical analysis of CpG methylation following a DSB is shown. Cassette I was arbitrarily divided in two segments located at −500 to −51 and −50 to + 420 bp relative to the I-SceI site. Methylation was measured as percent of methylated CpGs in each molecule relative to all CpGs present in the segment. GFP molecules were arbitrarily divided in three classes: unmethylated (0%–1% methylated sites), methylated (1.1%–6.5% in ES and 1.1%–3% in Hela), and hypermethylated 6.5%–50% and 3.1%–25% in Hela). The methylated class contains all molecules between ±1 standard deviation. After DSB and homologous recombination, the normal (Gaussian) distribution of methylated sites change to a bimodal distribution in both cell lines in the segment downstream to the break (p < 0.001 Shapiro-Wilk test, JMP statistical analysis software, http://www.jmp.com).
Figure 8
Figure 8. Methylation Patterns of Individual GFP DNA Molecules before or after HR
ClustalW analysis of individual GFP molecules (−50 to +420 bp relative to the DSB) derived from (A) ES, (B) Dnmt1−/−, and (C) Hela cell lines. Recombinant molecules were derived from cells sorted by GFP immunofluorescence as HR-L and HR-H in Figure 2B and 2C. To compare only methylation patterns, the same unrecombinant molecules shown in Figure 6A–6C were artificially transformed to recombinant molecules by substituting the I-SceI with the Bcg1 site. The percent of sequence variation is shown on the ordinate of the phylogenetic tree (dendrogram). The three main groups indicated in the dendrogram correspond to nonrecombinant (red) and recombinant sequences (black, HR-L and blue, HR-L clones). The variation in each group depends solely on the methylation pattern. The analysis has been performed on molecules derived from ~60 independent bisulfite reactions. The sequences that showed an identical pattern of methylation from the same bisulfite analysis were eliminated. For each sequence the percent of methylation is indicated at the bottom. The sequence analysis was performed using the MegAlign 7.0.1 a module of the Lasergene-DNASTAR software.
Figure 9
Figure 9. Dnmt1 Selectively Binds Recombinant GFP Chromatin
Hela cells carrying DR-GFP were transfected with I-SceI and treated 24 h later with 1 μM 5-AzadC for 1, 2, and 4 d. Chromatin immunoprecipitation (ChIp) was carried out as described in Materials and Methods. (A) PCR of immunoprecipitated DNA with antibodies to Dnmt1 is shown. None indicates chromatin derived from cells transfected with control plasmid, (−) or (+) indicates the treatment with 5-AzadC. Rec, unrec indicate the primers used for amplification. The lower panel shows the statistical analysis of PCR reactions carried out at 25 and 30 cycles when the reactions with the three sets of primers were in the linear range. Immunoprecipitations were carried out with nonspecific immunoglobulin G (Control immunoglobulin G) and anti-Dnmt1 specific antibodies. The primers used were: (1) unrec; (2) rec; and (3) actin (*, p < 0.01 versus control immunoglobulin G). (B) The conditions are the same as (A). MGMT and p16 indicate the primers used for amplification.
Figure 10
Figure 10. Mapping of GFP Transcription in Recombinant and Nonrecombinant Cells with and without 5-AzadC Treatment
(A) A schematic of the DR-GFP transcriptional unit shows the location of the CMV promoter, intron, and GFP coding sequence. Primers used for quantitative RT-PCR and RT-PCR are indicated by arrows. Different sets of primers were derived from the intron (738–757, forward 5′-CGTTACTCCCACAGGTGAGC-3′; 966–948, reverse 5′-CGCCCGTAGCGCTCACAGC-3′), AUG (1,666–1,685, forward 5′-TACAGCTCCTGGGCAACGTG-3′; 1,911–1,892, reverse, 5′-TCCTGCTCCTGGGCTTCTCG-3′), and BcgI/I-SceI (described in Figure 1A) segments of GFP gene. Control (DR-GFP cells transfected with pBluescript), HR-L, and HR-H cells were treated with 40 μM 5-AzadC for 48 h. Total RNA was extracted 24 h later and subjected to quantitative RT-PCR with the primers indicated. The data, derived from three independent cDNAs, are shown as fold induction by 5-AzadC over the basal control, normalized to GADPH and β-actin. The primers used to amplify the control samples were those indicated as I-SceI unrec (Figure 1A). (B) Shown is RT-PCR with the same cDNAs indicated in (A) at 30 cycles.
Figure 11
Figure 11. HR DNA Molecules Are Marked by Methylation Pattern Changes
A drawing illustrates how HR affects methylation. The case shown is a gene conversion event following a DSB at a specific chromosomal site with the GFP gene. The invasion of GFP cassette II (green) maintains the linearity of the DNA molecule at the I-SceI site. Methylation of only one repaired strand (the leading strand, in this specific example) is followed by an intermediate hemimethylated DNA molecule. Replication of this molecule yields fully methylated and nonmethylated DNA molecules. We suggest that Dnmt1 and the DSB repair machinery (BASC, BRCA1-associated surveillance complex) are strand-selective.
Figure 12
Figure 12. Biological Consequences of Recombination-Induced Methylation Switch
A drawing illustrates the sequence of events leading to silencing or expression of HR DNA segments. Red circles represent de novo methylated CpGs induced by HR. Black circles represent methylated CpGs before HR. Since silencing depends on the location of de novo methylated CpGs and DNA damage is random, HR-induced methylation is also random. If the expression of the repaired gene is harmful, only cells inheriting the silenced copy will survive. Conversely, if the function of the repaired gene is beneficial, cells inheriting the undermethylated copy will have a selective advantage.
Figure 13
Figure 13. Location of the Primers Used for Methylation Analysis
Schematic of the DR-GFP transcriptional unit is shown. The arrows indicate the specific primers.

Similar articles

Cited by

References

    1. Essers J, van Steeg H, de Wit J, Swagemakers SM, Vermeij M, et al. Homologous and non-homologous recombination differentially affect DNA damage repair in mice. Embo J. 2000;19:1703–1710. - PMC - PubMed
    1. Takata M, Sasaki MS, Sonoda E, Morrison C, Hashimoto M, et al. Homologous recombination and non-homologous end-joining pathways of DNA double-strand break repair have overlapping roles in the maintenance of chromosomal integrity in vertebrate cells. Embo J. 1998;17:5497–5508. - PMC - PubMed
    1. Taghian DG, Nickoloff JA. Chromosomal double-strand breaks induce gene conversion at high frequency in mammalian cells. Mol Cell Biol. 1997;17:6386–6393. - PMC - PubMed
    1. Elliott B, Richardson C, Winderbaum J, Nickoloff JA, Jasin M. Gene conversion tracts from double-strand break repair in mammalian cells. Mol Cell Biol. 1998;18:93–101. - PMC - PubMed
    1. Li E, Bestor TH, Jaenisch R. Targeted mutation of the DNA methyltransferase gene results in embryonic lethality. Cell. 1992;69:915–926. - PubMed

Publication types

MeSH terms