Comparative Study
. 2007 Sep 1;368(1):70-8.
doi: 10.1016/j.ab.2007.05.010. Epub 2007 May 13.

Performance characteristics of 65-mer oligonucleotide microarrays

Affiliations
Comparative Study

Performance characteristics of 65-mer oligonucleotide microarrays

Myoyong Lee et al. Anal Biochem. .

Abstract

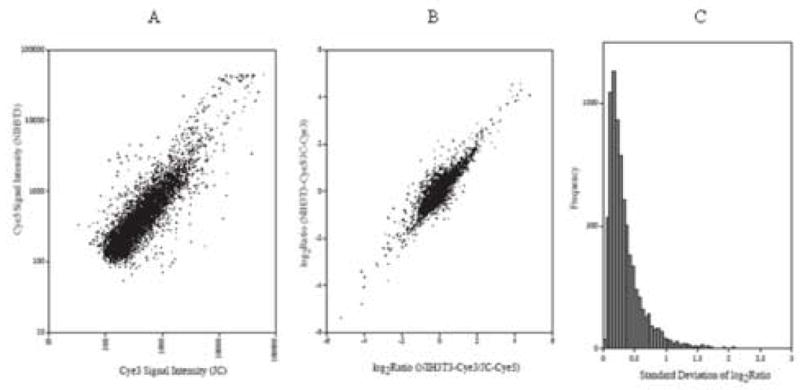
Microarray fabrication using presynthesized long oligonucleotide is becoming increasingly important, but a study of large-scale array productions has not yet been published. We addressed the issue of fabricating oligonucleotide microarrays by spotting commercial presynthesized 65-mers with 5' amines representing 7500 murine genes. Amine-modified oligonucleotides were immobilized on glass slides having aldehyde groups via transient Schiff base formation followed by reduction to produce a covalent conjugate. When RNA derived from the same source was used for Cy3 and Cy5 labeling and hybridized to the same array, signal intensities spanning three orders of magnitude were observed and the coefficient of variance (CV) between the two channels for all spots was 8 to 10%. To ascertain the reproducibility of ratio determination of these arrays, two triplicate hybridizations (with fluorochrome reversal) comparing RNAs from a fibroblast (NIH3T3) and a breast cancer (JC) cell line were carried out. The 95% confidence interval for all spots in the six hybridizations was 0.60 to 1.66. This level of reproducibility allows use of the full range of pattern finding and discriminant analysis typically applied to complementary DNA (cDNA) microarrays. Further comparative testing was carried out with oligonucleotide microarrays, cDNA microarrays, and reverse transcription (RT)-PCR assays to examine the comparability of results across these different methodologies.


Figures

Fig. 1
Fig. 1
Glass slide derivatization and oligonucleotide attachment. (A) The slide is first silanized with 3-glycidoxypropyltrimethoxysilane, and the epoxy rings are then opened to yield diols under acidic conditions. The cleavage of diols leads to the formation of aldehyde groups. (B) Attachment of 5′ end amino-modified oligonucleotides onto an aldehyde group activated slide surface via Schiff base formation. The Schiff base is reduced by sodium cyanoborohydride to give a stable alkylamine bond and remaining aldehyde groups are also reduced by sodium borohydride to lower background signals.
Fig. 2
Fig. 2
Homotypic hybridization results. (A) Typical scatter plot of the normalized Cy3 and Cy5 fluorescence intensities from an NIH3T3:NIH3T3 hybridization (single experiment). (B) Histogram showing the distribution of average log2(ratio) from three hybridizations for 5347 spots which have highest measurement quality in all 3 experiments.
Fig. 3
Fig. 3
Heterotypic hybridization results. (A) Normalized signal intensities are plotted (single experiment). (B) Average log2(ratio) from three NIH3T3:JC hybridizations versus average log2(inverted ratio) from three JC:NIH3T3 hybridizations. Plotted are 3797 spots that have highest measurement quality in all 6 experiments. (C) The distribution of the standard deviations of the log2(ratio) values for all spots (n=7812) in the dye swap experiments.
Fig. 4
Fig. 4
Dependency of signal intensity on concentration of oligonucleotide printed. (A) Average log10(fluorescence signal) from six hybridizations is plotted for 165 genes which are spotted in two concentrations, 10 μM (filled triangles) and 25μM (open squares). (B) Histogram showing the distribution of t-statistics applied to two fluorescence intensities for each gene. At α=0.05, the null hypothesis, that the sample populations are the same would be rejected for a t-statistic value greater than 2.23 (dotted lines).

References

    1. Southern EM, Maskos U. Parallel synthesis and analysis of large numbers of related chemical compounds: applications to oligonucleotides. J Biotechnol. 1994;35:217–227. - PubMed
    1. Pease AC, Solas D, Sullivan EJ, Cronin MT, Holmes CP, Fodor SPA. Light-generated oligonucleotide arrays for rapid DNA sequence analysis. Proc Natl Acad Sci USA. 1994;91:5022–5026. - PMC - PubMed
    1. Augenlicht LH, Taylor J, Anderson L, Lipkin M. Patterns of gene expression that characterize the colonic mucosa in patients at genetic risk for colonic cancer. Proc Natl Acad Sci USA. 1991;88:3286–3289. - PMC - PubMed
    1. Gress TM, Hoheisel JD, Lennon GG, Zehetner G, Lehrach H. Hybridization fingerprinting of high-density cDNA-library arrays with cDNA pools derived from whole tissues. Mamm Genome. 1992;3:609–619. - PubMed
    1. Schena M, Shalon D, Davis RW, Brown PO. Quantitative monitoring of gene expression patterns with a complementary DNA microarray. Science. 1995;270:467–470. - PubMed

Publication types

MeSH terms

Substances

LinkOut - more resources