. 2007 Aug 1;93(3):938-51.
doi: 10.1529/biophysj.106.097824.

Cysteine-cysteine contact preference leads to target-focusing in protein folding

Affiliations

Cysteine-cysteine contact preference leads to target-focusing in protein folding

Mihaela E Sardiu et al. Biophys J. .

Abstract

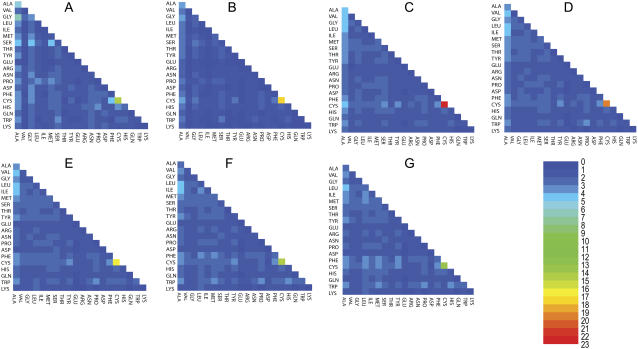
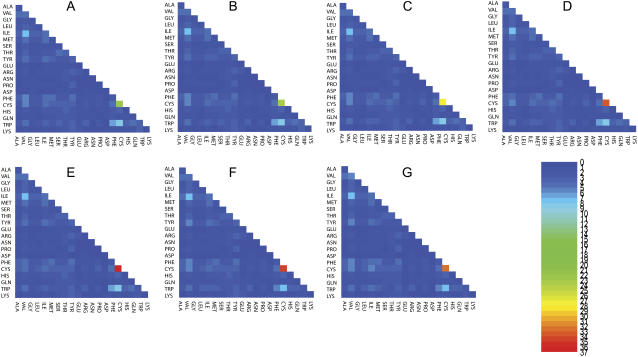
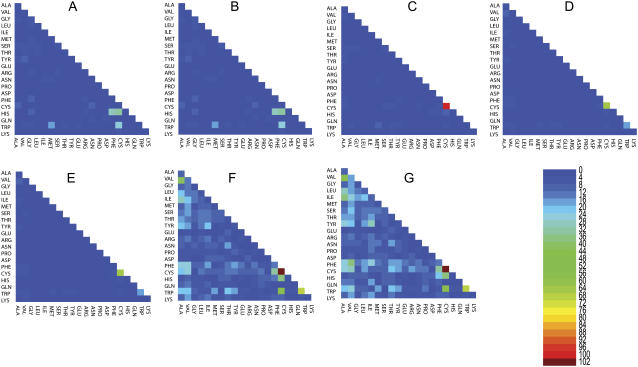
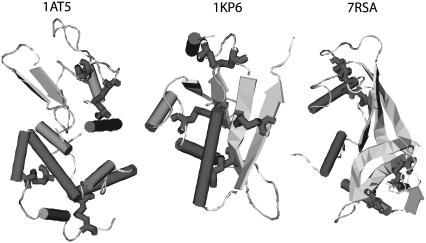
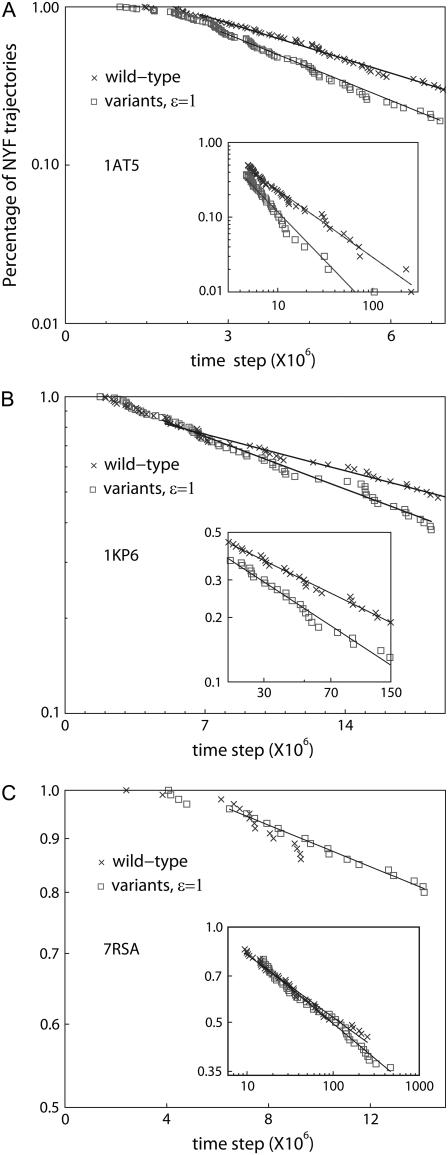
We perform a statistical analysis of amino-acid contacts to investigate possible preferences of amino-acid interactions. We include in the analysis only tertiary contacts, because they are less constrained--compared to secondary contacts--by proteins' backbone rigidity. Using proteins from the protein data bank, our analysis reveals an unusually high frequency of cysteine pairings relative to that expected from random. To elucidate the possible effects of cysteine interactions in folding, we perform molecular simulations on three cysteine-rich proteins. In particular, we investigate the difference in folding dynamics between a Gō-like model (where attraction only occurs between amino acids forming a native contact) and a variant model (where attraction between any two cysteines is introduced to mimic the formation/dissociation of native/nonnative disulfide bonds). We find that when attraction among cysteines is nonspecific and comparable to a solvent-averaged interaction, they produce a target-focusing effect that expedites folding of cysteine-rich proteins as a result of a reduction of conformational search space. In addition, the target-focusing effect also helps reduce glassiness by lowering activation energy barriers and kinetic frustration in the system. The concept of target-focusing also provides a qualitative understanding of a correlation between the rates of protein folding and parameters such as contact order and total contact distance.


Figures

FIGURE 1
FIGURE 1
The probability ratios (explained in pairwise tertiary contact analysis) for tertiary contacts among helical secondary structures. The number key is given by the heat map. In the alphabetical order of the panels, from A to G, we display the probability ratios with different cutoff distances ranging from 5 Å to 8 Å with a 0.5 Å increment. Thus, panel A summarizes the results for using 5 Å as the cutoff distance, while panel G summarizes the results for using 8 Å as the cutoff distance.
FIGURE 2
FIGURE 2
The probability ratios (explained in pairwise tertiary contact analysis) for tertiary contacts among β-sheet secondary structures. The number key is given by the heat map. In the alphabetical order of the panels, from A to G, we display the probability ratios with different cutoff distances ranging from 5 Å to 8 Å with a 0.5 Å increment. Thus, panel A summarizes the results for using 5 Å as the cutoff distance, while panel G summarizes the results for using 8 Å as the cutoff distance.
FIGURE 3
FIGURE 3
The probability ratios (explained in Pairwise Tertiary Contact Analysis) for tertiary contacts formed between different secondary structures, i.e., contacts between helices and sheets. The number key is given by the heat map. In the alphabetical order of the panels, from A to G, we display the probability ratios with different cutoff distances ranging from 5 Å to 8 Å with a 0.5 Å increment. Thus, panel A summarizes the results for using 5 Å as the cutoff distance, while panel G summarizes the results for using 8 Å as the cutoff distance.
FIGURE 4
FIGURE 4
The native structures, downloaded from the Protein DataBank, of the three proteins studies. Displayed from left to right are: the hen egg-white lysozyme (1AT5), U. maydis killer toxin kp6 α-subunit (1KP6), and bovine pancreatic ribonuclease A (7RSA). While the bulk of the proteins are in ribbon (β-strand) and cylinder (α-helix) representations, cysteine residues are shown using bond representation.
FIGURE 5
FIGURE 5
Percentage of NYF trajectories versus time for the three proteins considered. Note that the percentage of NYF is always plotted in log scale while the time step is plotted in linear scale in the figure but in log scale in the insets. The exponents' α-values are obtained by fitting the power law in the insets. Both the α-values and the inverse characteristic timescales τ−1 are given in Table 4.
FIGURE 6
FIGURE 6
Deviation from expected contact numbers (DFECN) versus integration time steps for protein 1AT5. DFECN is computed for noncysteine residue 53 that has the largest number of native Gō contacts and for residue 94 that is a cysteine. Panels A(a) and A(b) show DFECNs of native contacts and nonnative contacts, respectively, from a folding trajectory of a wild-type protein; and panels A(c) and A(d) show DFECNs of native contacts and nonnative contacts, respectively, from another folding trajectory of the variant. The same initial structure is given for both the wild-type and the variant in folding simulations, and the variant folds faster than the wild-type. In addition, another set of folding simulations (B(a)–B(d)) is given to show that nonspecific cysteine-cysteine interactions facilitate folding. Particularly in this case, the wild-type trajectory did not reach the native state within the maximum folding time (i.e., 30 × 106 time steps). However, the variant did. The legends of B(a)–B(d) are the same as those of panels A(a)–A(d). DFECN of native contacts associated with 53 is large and negative in panel B(a) while DFECN of nonnative contacts associated with 94 became frequently positive in panel B(b). It indicates that for a wild-type protein, contact pairing to 53 is far from nativelike, and contact pairing to 94 is overwhelmed by nonnative ones. Such conformations form kinetic traps that impede folding (B(a) and B(b)). However, when the nonspecific attraction among cysteines is introduced (i.e., variant B(c) and B(d)), it helps in circumventing such kinetic traps and allows the variant model to reach the native state in a much shorter time. DFECN is averaged over a window size of W = 1.5 × 10⁵.
FIGURE 7
FIGURE 7
Deviation from expected contact number (DFECN) versus integration time steps of protein 1KP6. In general, the variant model folds faster than the wild-type. DFECNs of residue 61 (which has the most content of native Gō contacts) and residue 5 (a cysteine) are plotted. Using the same initial configurations, we run MD simulations for the wt model and for the variant model. Panel A shows the DFECN of native kind of the wt; panel B shows the DFECN of nonnative kind of the wt; panel C shows the DFECN of native kind of the variant; and panel D shows the DFECN of nonnative kind of the variant. In essence, slow folders usually suffer more frequent kinetic frustration compared to the fast folders.
FIGURE 8
FIGURE 8
Deviation from expected contact number (DFECN) versus integration time steps of protein 7RSA. In general, the variant model folds significantly faster than the wild-type. DFECNs of residue 6 (which has the most content of native Gō contacts) and residue 72 (a cysteine) are plotted. Using the same initial configurations, we run MD simulations for the wt model and for the variant model. Panel A shows the DFECN of native kind of the wt; panel B shows the DFECN of nonnative kind of the wt; panel C shows the DFECN of native kind of the variant; and panel D shows the DFECN of nonnative kind of the variant. DFECN is averaged over a window size of W = 1.5 × 10⁵.
FIGURE 9
FIGURE 9
Energy versus time step for wt protein models. Panel A plots the energy versus time of a slow folding trajectory from protein model 7RSA wt; the folding time of this trajectory is within the range describable by power law. Panel B plots the energy versus time of a slow folding trajectory from protein model 1AT5 wt; the folding time of this trajectory again is within the range describable by power law. These typical energy versus time plots do not show any clear descending trend in energy and thus do not lend support to the glassiness-free down-hill folding scenario. In particular, the typical energy differences, 2.9 and 3.4 units for 7RSA wt and 1AT5 wt, respectively, over a time interval of 1500 time steps for both trajectories are approximately one order-of-magnitude smaller than their respective peak-to-valley values.
FIGURE 10
FIGURE 10
Comparison of triple-exponential fitting and power-law fitting. The plots are shown in log-log scale. For visual clarity, we have divided the time steps associated with the variant models by a factor of two, resulting in a parallel shift to the left for all the variant models. (A) We plot the percentage of NYF trajectories versus simulation time steps for protein model 7RSA wt and 7RSA variant. At large time range, both the wt and variant are well fitted by power law. The wt is also fitted by triple exponentials with coefficients (see Eq. 8) given by t0 = 3.92 × 10⁶, A1 = 0.3515, A2 = 0.21711, τ1 = 1.2277 × 10⁷, τ2 = 9.5925 × 10⁷, and τ3 = 5 × 1049. Although triple exponential seems a reasonable fit in the data range displayed, the largeness of τ3 seems to contradict the purpose of triple-exponential fitting (see text for detail). (B) We plot the percentage of NYF trajectories versus simulation time steps. The best triple-exponential fitting, with parameters t0 = 1.771 × 10⁶, A1 = 2.19 × 10⁻⁵, A2 = 0.933, τ1 = 2.01 × 10⁶, τ2 = 4.12 × 10⁶, and τ3 = 5 × 1042, apparently does not fit the large time part. However, the large time regions for both the wt and the variant are well fitted by a power law.
FIGURE 11
FIGURE 11
Simulation steps for the wt model and the new variant model of protein 1AT5. The new variant model assigns a nonspecific attraction to every methionine-tryptophan pair with ε = 1 as in Eq. 5; nonspecific cysteine interactions are not included. In this log-log plot, for the wt only the trajectories finishing at late time are shown (see inset, Fig. 5 A). We note that the percentage NYF for the new variant remains 100% for a rather long time, and after that is well described by a power law, signifying a predominantly glassy system.

Similar articles

Cited by

References

    1. Fersht, A. R. 1999. Structure and Mechanism in Protein Science. W. H. Freeman and Company, New York.
    1. Creighton, T. E. 1992. Protein Folding. W. H. Freeman and Company, New York.
    1. Miyazawa, S., and R. L. Jernigan. 1996. Residue-residue potentials with a favorable contact pair term and an unfavorable high packing density term, for simulation and threading. J. Mol. Biol. 256:623–644. - PubMed
    1. Abkevich, V. I., and E. I. Shakhnovich. 2000. What can disulfide bonds tell us about protein energetics, function and folding: simulations and bioinformatics analysis. J. Mol. Biol. 300:975–985. - PubMed
    1. Mallick, P., D. R. Boutz, D. Eisenberg, and T. O. Yeates. 2002. Genomic evidence that the intracellular proteins of archeal microbes contain disulfide bonds. Proc. Natl. Acad. Sci. USA. 99:9679–9684. - PMC - PubMed

Publication types

LinkOut - more resources