. 2007 Jul 15;179(2):1353-61.
doi: 10.4049/jimmunol.179.2.1353.

Omalizumab reverses the phenotypic and functional effects of IgE-enhanced Fc epsilonRI on human skin mast cells

Affiliations

Omalizumab reverses the phenotypic and functional effects of IgE-enhanced Fc epsilonRI on human skin mast cells

Gregorio Gomez et al. J Immunol. .

Abstract

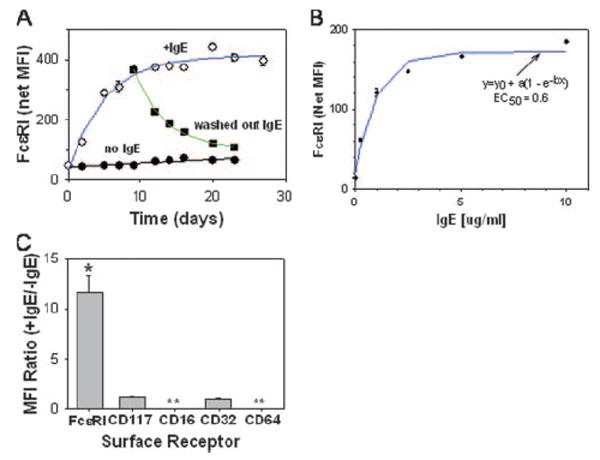
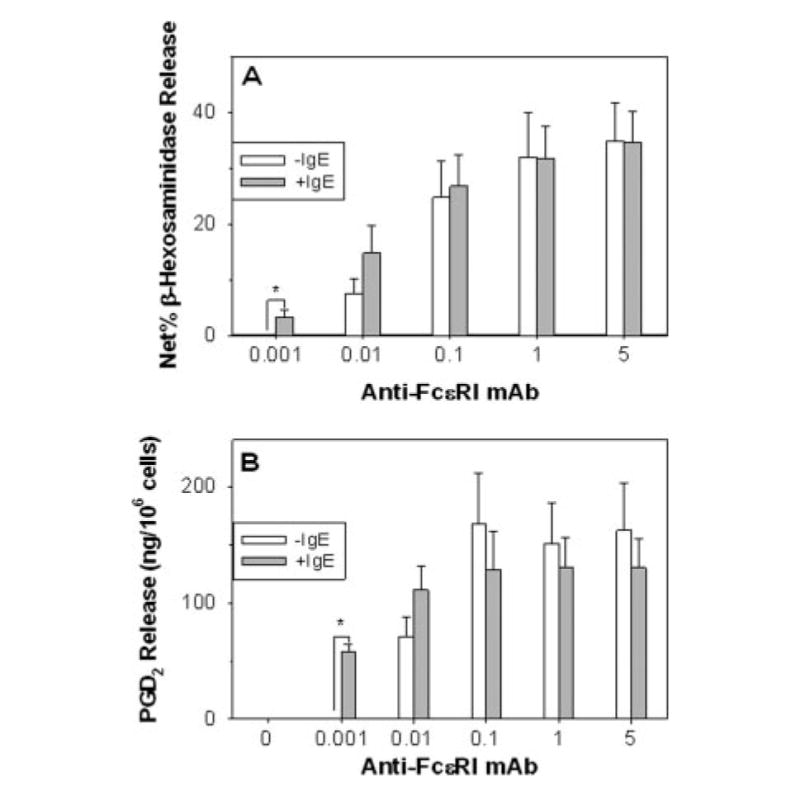
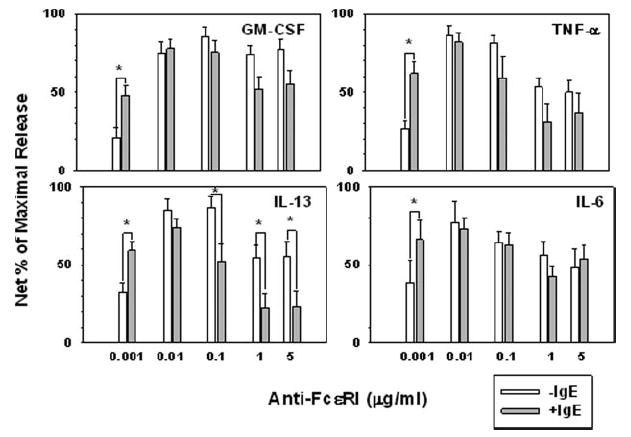
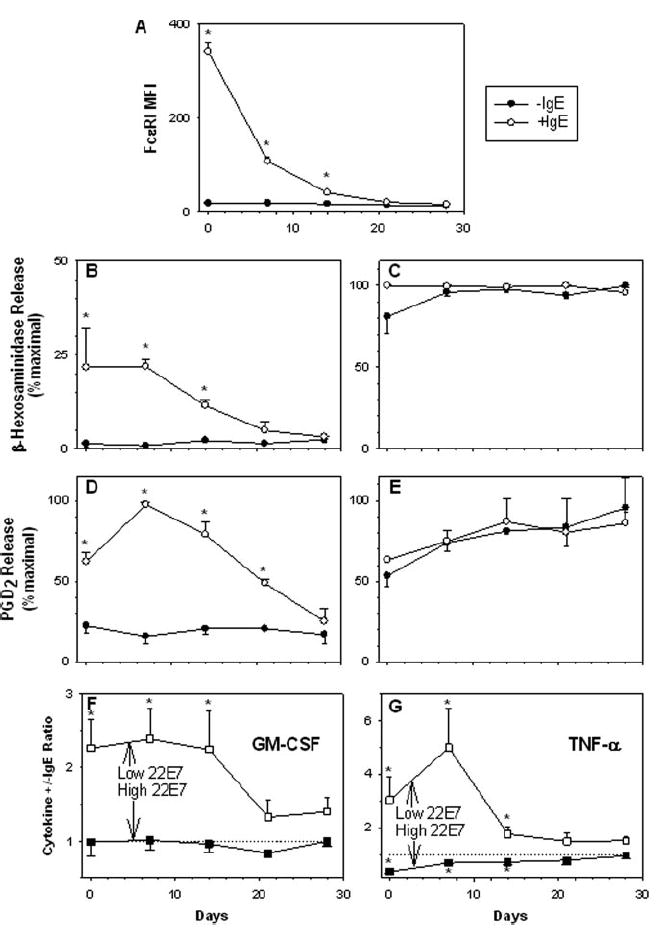
The dramatic effects of the anti-IgE mAb omalizumab to lower free IgE levels and Fc epsilonRI levels on basophils contrast with more modest clinical effects. Accordingly, whether IgE modulates Fc epsilonRI levels and Fc epsilonRI-dependent mediator release in vitro on human skin mast cells (MC(TC) type) that had matured in vivo is of interest. IgE reversibly enhanced Fc epsilonRI levels on MC(TC) cells in a dose- and time-dependent manner (up-regulation t(1/2) of 4-5 days with 1-3 microg/ml IgE), without affecting cell proliferation. A molar ratio of omalizumab to IgE of 0.9 at baseline prevented receptor up-regulation by 50%, whereas adding omalizumab to MC(TC) cells already with IgE-enhanced Fc epsilonRI levels at molar ratios of 5, 12.5, and 31 reduced Fc epsilonRI levels to baseline with respective t(1/2) values of 8.7, 6.3, and 4.8 days. MC(TC) cells with IgE-enhanced Fc epsilonRI levels were more sensitive to stimulation with a low dose of anti-Fc epsilonRI mAb in terms of degranulation and production of PGD(2), GM-CSF, IL-6, IL-13, and TNF-alpha. Reducing up-regulated Fc epsilonRI levels with omalizumab also reduced mediator release to a low dose of anti-Fc epsilonRI mAb to baseline by 3-4 wk. Thus, reducing free IgE should decrease the hypersensitivity of allergic individuals to low naturally occurring concentrations of allergens.


Figures

FIGURE 1
FIGURE 1
IgE enhances FcεRI expression on the surface of skin mast cells. A, Time course for up-regulation of FcεRI by chimeric human IgE mAb (3 μg/ml) and down-regulation by washing out IgE as measured by flow cytometry. ○, Up-regulation with IgE; ■, washout of IgE; ●,no IgE. The t1/2 for FcεRI up-regulation (3.6 days) was calculated after fitting the data to an exponential equation [y = yo+a(1 − ebt)], where y is the MFI at t > 0 h, y0 is the MFI at 0 h, t is time (in hours), a is the maximal net increase in MFI, and b is a calculated constant. The t1/2 for FcεRI down-regulation (5.1 days) was calculated from the exponential decay equation [y = yo + aebt], where yo is the FcεRI-dependent MFI in cultures for which IgE had never been added, y is the MFI over time after IgE had been removed, a is the net increase in MFI above y0 at the time IgE was re moved, t is the time after IgE had been removed, and b is a calculated constant. B, Dose-response of FcεRI up-regulation by IgE after 2 wk. The ED50 (0.6 μg/ml) was calculated by fitting the data to the exponential equation y =y0 + a(1 – ebx), where y is the MFI when the IgE concentration (in micrograms per milliliter) is >0, y0 is the MFI when IgE concentration is 0, x is the IgE concentration, a is the maximal net increase in MFI, and b is a calculated constant. C, FcεRI is selectively up-regulated on skin mast cells by IgE. IgE (1 μg/ml) was added to skin mast cell cultures for 7 days at which time the MFI ratios (+IgE/ −IgE cultures) for FcεRI, CD117, CD16, CD32, and CD64 were determined. *, p < 0.05 compared with unity, Student’s paired two-tailed t test. **, None detected.
FIGURE 2
FIGURE 2
IgE-dependent enhancement of FcεRI on skin mast cells is both prevented and reversed by anti-IgE mAb. A, Anti-IgE attenuated IgE-mediated enhancement of FcεRI MFI. Polyclonal human IgE (1 μg/ml) in medium containing varying amounts of anti-IgE (omalizumab) was added to skin mast cell cultures for 7 days, at which time the FcεRI MFI was determined. The data were fit to an exponential decay equation (y = y0 + aebx), where y0 is the MFI at the time IgE with or without anti-IgE were added to the mast cell cultures, a is the maximal net increase in MFI above y0, b is a calculated constant, and x is the weight ratio of anti-IgE to IgE. Data from each of three separate cultures were first normalized to the maximal MFI achieved (set to 100), and then combined for analysis. Maximal MFI values were 292, 328, and 673. B, Anti-IgE down-regulates IgE-enhanced FcεRI expression. Skin mast cells were cultured without (○, black line) or with (●, red line) polyclonal human IgE (1 μg/ml) for 1 wk. At that time, the cells were washed, and a portion was resuspended with IgE-free medium (□, green line) and another portion with medium containing anti-IgE (25 μg/ml) (Δ, yellow line). Alternatively, IgE was left in the culture and anti-IgE was added at concentrations of 4 μg/ml (▽, blue line), 10 μg/ml (◊, purple line), and 25 μg/ml ( formula image
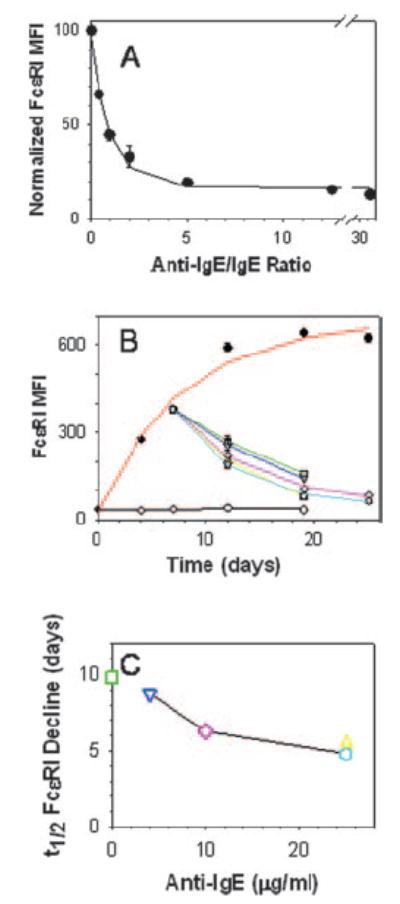
, light blue line). Each data point is the mean of triplicate determinations. C, Relationship of the t1/2 for the decline in IgE-enhanced FcεRI MFI to the amount of anti-IgE. Data from B were used to calculate t1/2 values. Symbols are the same as in B, and symbol colors correspond to the line colors in B.
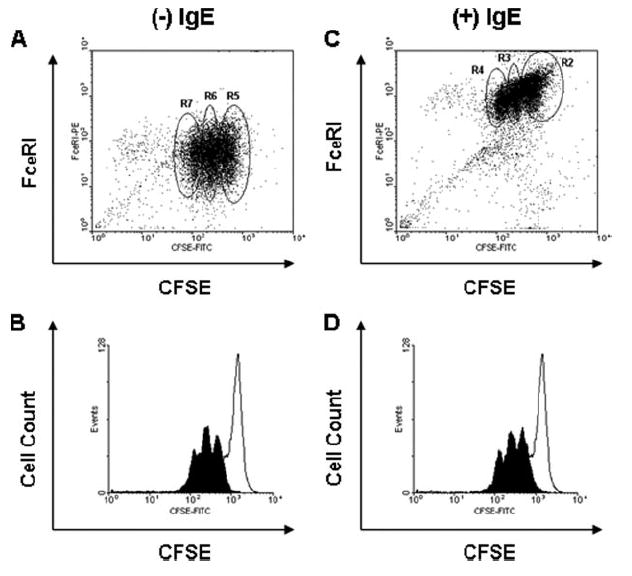
FIGURE 3
FIGURE 3
IgE-enhanced expression of FcεRI does not affect proliferation. Skin mast cells were labeled with CFSE and cultured without (A and B) and with (C and D) polyclonal human IgE (1 μg/ml) for 8 days, and analyzed for relationships between FcεRI expression and CFSE fluorescence (A and C) and between cell counts and CFSE fluorescence (B and D). The open histograms in B and D were produced within 24 h after CFSE labeling, whereas the closed histograms were produced 8 days after labeling. Mean data from the regions labeled in the A and C are presented in Table I from four independent experiments.
FIGURE 4
FIGURE 4
Skin mast cells with IgE-enhanced FcεRI expression are more sensitive to 22E7 in terms of degranulation and PGD2 secretion. Skin mast cells were cultured without or with polyclonal human IgE (1 μg/ml) for 1 wk, and then stimulated with varying concentrations of 22E7 for 30 min at 37°C. Degranulation in terms of β-hexosaminidase release (A) and PGD2 release (B) were then assessed. Mean ± SE data are shown for five (β-hexosaminidase) and four (PGD2) independent experiments. Spontaneous percentage release values (mean ± SD) of 5.3 ± 1.2 (−IgE) and 5.2 ± 1.4 (+IgE) were not significantly different. *, p < 0.05 between −IgE and +IgE.
FIGURE 5
FIGURE 5
Skin mast cells with IgE-enhanced FcεRI expression are more sensitive to low-level FcεRIα aggregation-induced cytokine secretion. Skin mast cells were cultured without or with polyclonal human IgE (1 μg/ml) for 7 days, and then stimulated with varying concentrations of 22E7 for 24 h at 37°C in medium containing SCF and SBTI. The concentrations of cytokines in the cell-free supernatants were quantified by ELISA. The bars represent the mean ± SEM of 12 (GM-CSF), 10 (TNF-α), and 9 (IL-13 and IL-6) independent experiments with different mast cell preparations. Spontaneous release values (median) for minus vs plus IgE groups, respectively, did not differ significantly (Mann-Whitney rank sum test, p > 0.05) for GM-CSF (120 and 100 pg/ml), TNF-α (72 and 43 pg/ml), IL-13 (<32 and <32 pg/ml), and IL-6 (545 and 621 pg/ml). Maximal release values (net) varied between different mast cell preparations: GM-CSF (199–25,998 pg/106 cells), TNF-α (176–2,677 pg/106 cells), IL-13 (110–2,506 pg/106 cells), and IL-6 (590–4,997 pg/106 cells). *, p < 0.05 (Student’s paired two-tailed t test between −IgE and +IgE).
FIGURE 6
FIGURE 6
Down-regulation of IgE-enhanced FcεRI expression with omalizumab reverses augmented degranulation and production of PGD2, GM-CSF, and TNF-α to basal levels. Skin mast cells were cultured for 7 days without (●) or with (○) polyclonal human IgE (1 μg/ml) (A–E), and then the anti-IgE mAb omalizumab (25 μg/ml) was added over a 4-wk period. Omalizumab and IgE were replenished weekly. FcεRI levels were measured weekly (A) and samples of mast cells were activated with 0.001 μg/ml (B and D) or 1 μg/ml (C and E) 22E7. Degranulation (B and C) and PGD2 release (D and E) then were assessed. Mean ± SE are shown for three experiments with different mast cell preparations. Respective spontaneous release values for −IgE and +IgE groups did not significantly differ for β-hexosaminidase, 7.9 ± 1.2 and 8.1 ± 1.5% 0.11 and for PGD2, 0.38 ± 0.11 and 0.34 ± 0.18 ng/106 cells. GM-CSF (F) and TNF-α (G) release was determined by ELISA following activation with 22E7 for 24 h at 37°C in medium containing SCF and SBTI. To compare different mast cell cultures, the ratio of the percentage of net maximal release from the +IgE/ −IgE groups stimulated with 0.001 μg/ml (□) and 1 μg/ml (■) of 22E7 at each time point is plotted against days in culture with omalizumab. The dashed line (ratio, 1) indicates the point at which the percentage net maximal release of the +IgE and −IgE groups is equal. The data represent the mean ± SEM of four to five independent experiments with different mast cell preparations. *, p < 0.05 between −IgE and + IgE using a Student’s two-tailed t test.

Similar articles

Cited by

References

    1. Asai K, Kitaura J, Kawakami Y, Yamagata N, Tsai M, Carbone DP, Liu FT, Galli SJ, Kawakami T. Regulation of mast cell survival by IgE. Immunity. 2001;14:791–800. - PubMed
    1. Kawakami T, Galli SJ. Regulation of mast-cell and basophil function and survival by IgE. Nat Rev Immunol. 2002;2:773–786. - PubMed
    1. Kitaura J, Song J, Tsai M, Asai K, Maeda-Yamamoto M, Mocsai A, Kawakami Y, Liu FT, Lowell CA, Barisas BG, et al. Evidence that IgE molecules mediate a spectrum of effects on mast cell survival and activation via aggregation of the FcepsilonRI. Proc Natl Acad Sci USA. 2003;100:12911–12916. - PMC - PubMed
    1. Lantz CS, Yamaguchi M, Oettgen HC, Katona IM, Miyajima I, Kinet JP, Galli SJ. IgE regulates mouse basophil FcεRI expression in vivo. J Immunol. 1997;158:2517–2521. - PubMed
    1. Yamaguchi M, Lantz CS, Oettgen HC, Katona IM, Fleming T, Miyajima I, Kinet JP, Galli SJ. IgE enhances mouse mast cell FcεRI expression in vitro and in vivo: evidence for a novel amplification mechanism in IgE-dependent reactions. J Exp Med. 1997;185:663–672. - PMC - PubMed

Publication types

MeSH terms