. 2007 Aug;10(8):1038-47.
doi: 10.1038/nn1935. Epub 2007 Jul 8.

A functional link between area MSTd and heading perception based on vestibular signals

Affiliations

A functional link between area MSTd and heading perception based on vestibular signals

Yong Gu et al. Nat Neurosci. 2007 Aug.

Abstract

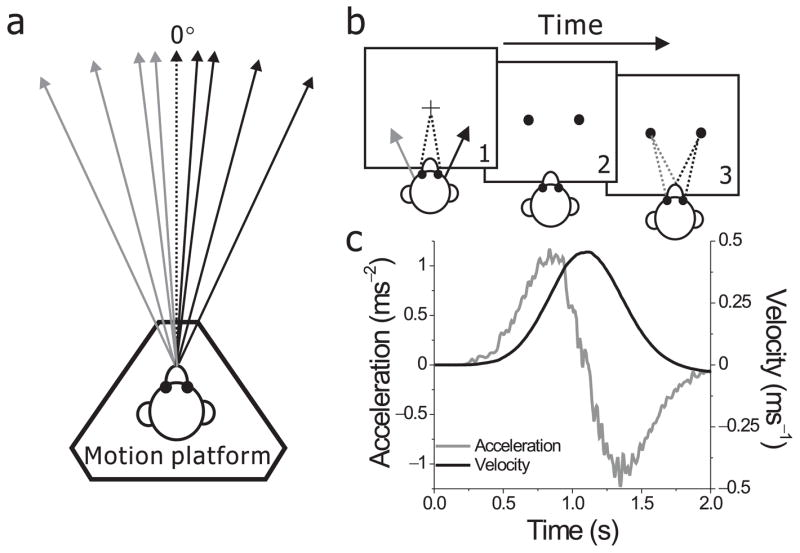
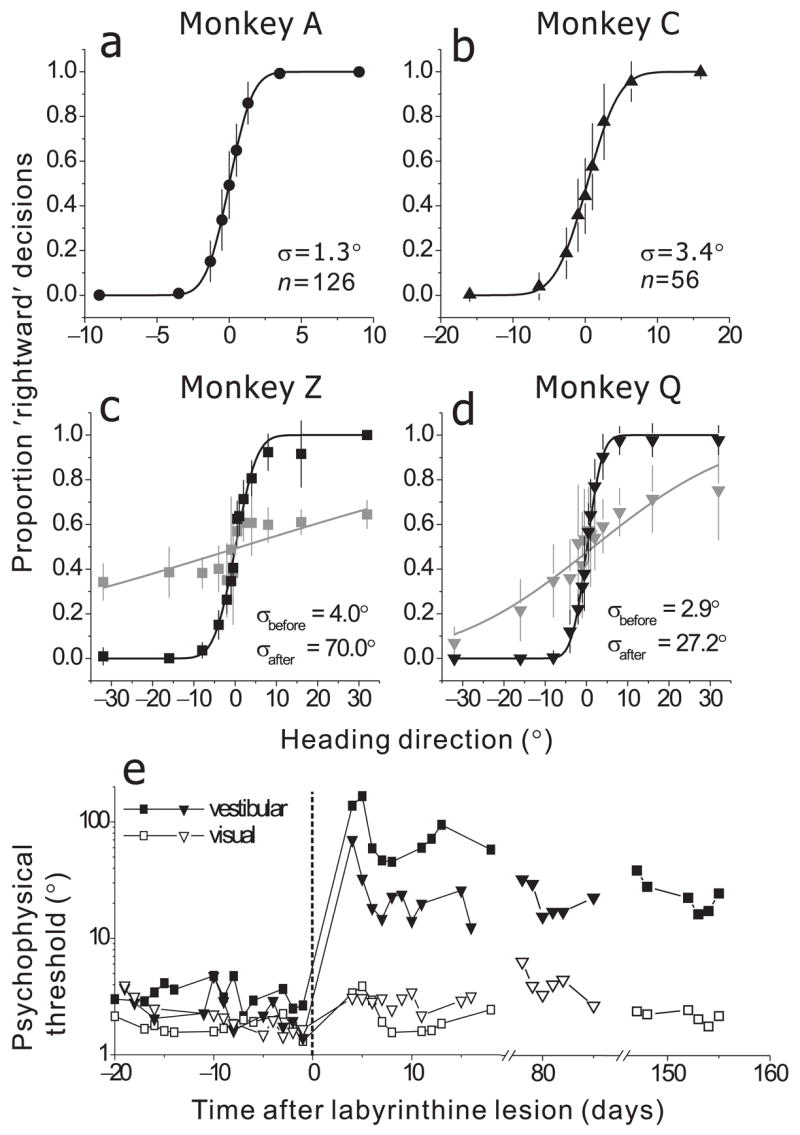
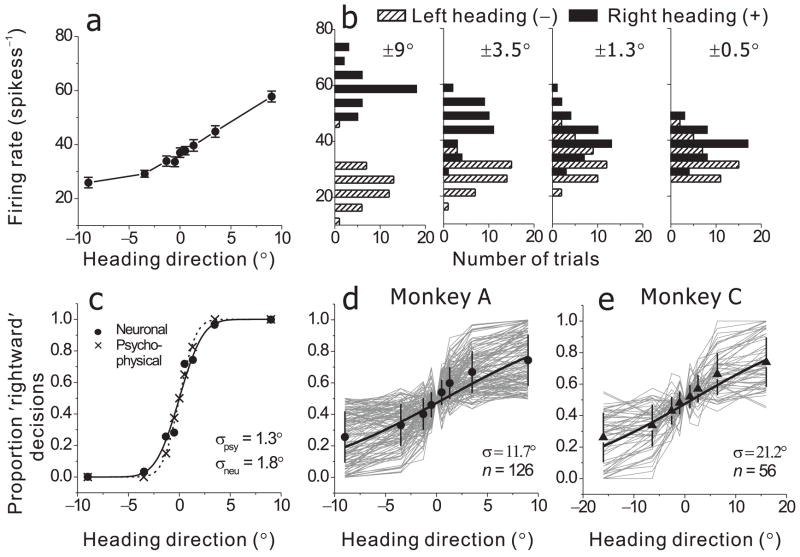
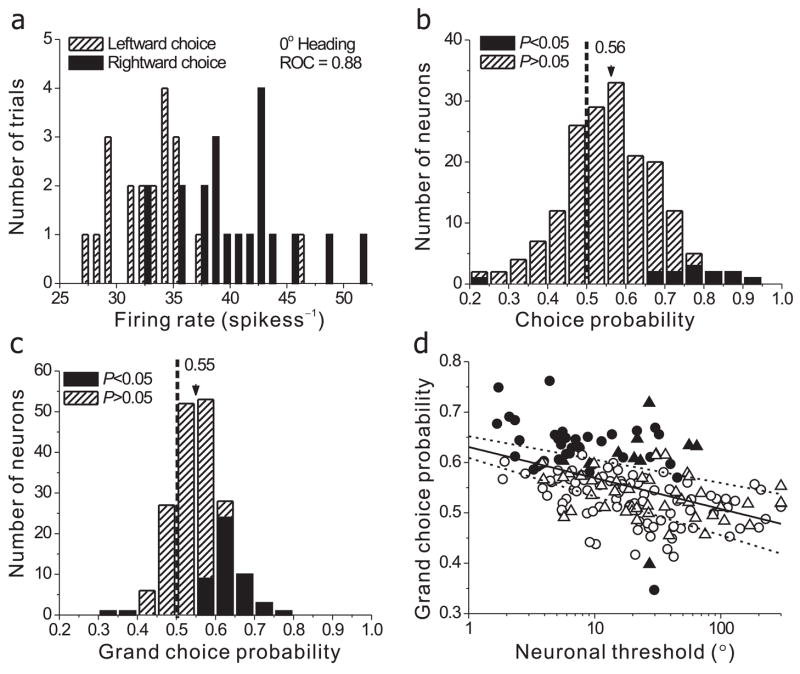
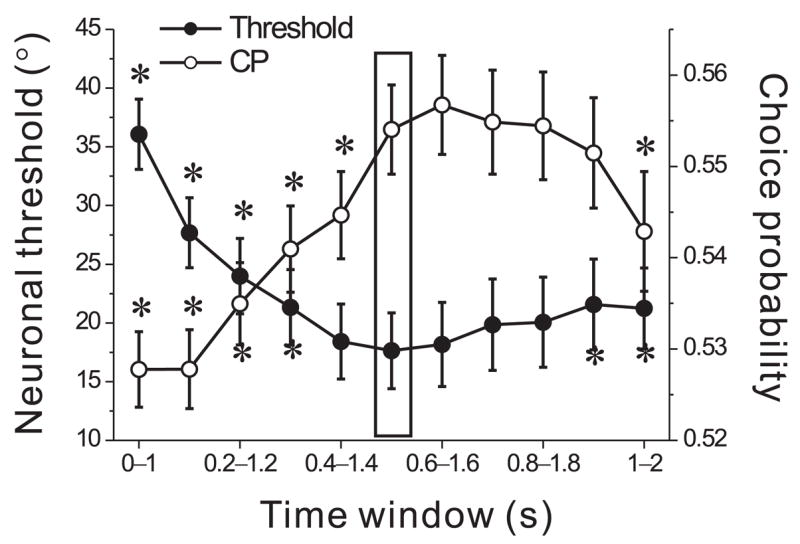
Recent findings of vestibular responses in part of the visual cortex--the dorsal medial superior temporal area (MSTd)--indicate that vestibular signals might contribute to cortical processes that mediate the perception of self-motion. We tested this hypothesis in monkeys trained to perform a fine heading discrimination task solely on the basis of inertial motion cues. The sensitivity of the neuronal responses was typically lower than that of psychophysical performance, and only the most sensitive neurons rivaled behavioral performance. Responses recorded in MSTd were significantly correlated with perceptual decisions, and the correlations were strongest for the most sensitive neurons. These results support a functional link between MSTd and heading perception based on inertial motion cues. These cues seem mainly to be of vestibular origin, as labyrinthectomy produced a marked elevation of psychophysical thresholds and abolished MSTd responses. This study provides evidence that links single-unit activity to spatial perception mediated by vestibular signals, and supports the idea that the role of MSTd in self-motion perception extends beyond optic flow processing.


Figures

Figure 1
Figure 1
Experimental setup and stimuli. (a) Using a motion platform, animals were translated forward along different heading directions in the horizontal plane. 0° heading denotes straight forward translation. (b) Each trial started with the appearance of a small fixation point in the center of the screen. Monkeys fixate the target while being passively moved. As soon as motion is completed, the fixation point disappears and two choice targets appear. Monkeys are required to make a saccade to one of the two targets to report their perceived heading direction (left or right relative to straight-ahead). (c) The inertial motion stimulus followed a Gaussian velocity profile (black) over the stimulus duration of 2s. The corresponding acceleration profile was biphasic (gray) with a peak acceleration of 0.1 G. The gray curve illustrates the output of a linear accelerometer attached to the motion platform, whereas the black curve corresponds to its integral.
Figure 2
Figure 2
Psychophysical performance in the heading discrimination task. (a, b, c, d) Average psychometric functions for 4 different animals, plotted as proportion of ‘rightward’ decisions (±SD) as a function of heading direction (black symbols). Each datum represents the average across all experimental sessions. Smooth curves represent cumulative Gaussian fits to the data. For monkeys Z and Q, gray symbols and lines illustrate the average psychometric function over several sessions during the first 2 weeks following bilateral labyrinthectomy. (e) Daily psychophysical thresholds before and after labyrinthectomy (0 marks the day of surgery). Data obtained during the heading discrimination task in the absence of optic flow (filled symbols, ‘Vestibular’) are compared with those from a similar task in which heading was defined exclusively by optic flow (open symbols, ‘Visual’). Circles: monkey Z. Triangles: monkey Q.
Figure 3
Figure 3
Visual and vestibular tuning for heading. (a) Heading tuning curves for a typical MSTd neuron with congruent visual and vestibular responses. Heading direction was varied in the horizontal plane (8 directions, 45° apart, plus two additional directions ±22.5° away from 0°). The mean firing rate (±SD) calculated during the middle 1s of the stimulus period is plotted as a function of heading direction. Black circles/lines: vestibular condition. Red circles/lines: visual condition. Gray vertical shaded area illustrates the narrow range of motion directions tested during the heading discrimination task. (b) Population vestibular and visual tuning curves, (n=256). Visual responses (red) of each neuron were shifted to align the peaks of all tuning curves (at 0°) prior to averaging across the population. Vestibular responses were averaged across neurons after being aligned either to the vestibular maximum response direction (black) or to the visual maximum response direction (blue). (c) Population vestibular and visual tuning after labyrinthectomy (n=75). Same format as in b. Gray bands in panels b and c indicate the average spontaneous firing rate ± SE. Note that visual responses were larger than spontaneous activity in all directions.
Figure 4
Figure 4
Quantification and summary of neuronal sensitivity. (a) Responses (mean±SE) of the same cell as in Fig. 3a during the heading direction discrimination task, tested using a narrow range of 9 heading angles placed symmetrically around straight ahead (0°). Positive values correspond to rightward directions. (b) Response distributions for four pairs of headings (±9°, ±3.5°, ±1.3° and ±0.5°), shown separately for leftward (hatched bars) and rightward (filled bars) motion directions. (c) Proportion ‘rightward’ decisions as a function of heading direction is shown for both the psychophysical (x’s) and neuronal responses (filled circles). The latter was computed using ROC analysis. Dashed and solid curves show cumulative Gaussian fits to the psychometric and neurometric functions. Threshold performance for each function (σpsy or σneu) was computed as the standard deviation of the Gaussian fit. (d,e) Thin gray curves show individual neurometric functions for all neurons recorded from monkey A (N=126) and monkey C (N=56). Filled symbols and thick curves show average neurometric functions for the two animals.
Figure 5
Figure 5
Comparison of psychophysical and neuronal thresholds for all individual experiments (monkey A: filled circles; monkey C: open triangles). The diagonal histogram shows the distribution of neuronal to psychophysical (N/P) threshold ratios (monkey A: filled bars; monkey C: hatched bars). Arrows illustrate mean N/P ratios for monkey A (filled arrowhead) and monkey C (open arrowhead).
Figure 6
Figure 6
Trial-to-trial covariation between neural activity and behavioral choices (i.e., choice probability, CP). (a) Distribution of mean firing rates of a single MSTd neuron in response to an ambiguous 0° heading stimulus, grouped according to whether the monkey reported ‘leftward’ or ‘rightward’ motion. This example neuron is the same as the cell in Fig. 3a & Fig. 4a,b. The choice-related difference between the two response distributions yielded a highly significant choice probability, CP = 0.88 (p≪0.001). (b) Summary of CPs for 178 MSTd neurons for which the ambiguous 0° heading stimulus yielded a minimum of 3 leftward and rightward choices (for 4 neurons, this was not the case because of a behavioral bias, see Methods). Filled bars represent individual CP measurements that are significantly different from 0.5 (p < 0.05, permutation test). The arrowhead illustrates the population mean. (c) Summary of grand CPs (n=182) calculated by combining data across all heading directions, following normalization. No cells were excluded in this case since the monkey made at least 3 leftward and rightward choices. (d) Choice probability is significantly anti-correlated with neuronal threshold (the solid line indicates the best linear fit and the dashed curves indicate the 95% confidence interval for the slope). Neurons with lower thresholds tend to have larger CPs. Filled symbols represent individual CP measurements that are significantly different from 0.5 (p < 0.05, permutation test). Circles: monkey A; Triangles: monkey C.
Figure 7
Figure 7
Dependence of average neuronal thresholds (filled circles) and CPs (open circles) on the temporal analysis window used to compute mean firing rates. The vertical rectangle indicates values computed from responses during the middle 1s of the 2s stimulus epoch. Each other point represents a 1s analysis window that is shifted by a multiple of 100ms. Asterisks mark the thresholds and CPs that were significantly different from those computed for the middle 1s analysis window.
Figure 8
Figure 8
Comparison of neuronal thresholds (a) and CPs (b) for neurons tested with the dark free viewing variant (n = 26) and standard fixation version (n = 21) of the heading discrimination task. The two conditions were run in separate blocks of trials starting always with the dark free viewing condition first. Thus, the scatter plots include data from the 21 neurons that were isolated long enough to be tested under both task conditions. Both thresholds (a) and CPs (b) were very similar between the two task conditions. Filled bars in (b) represent neurons with CPs significantly different from 0.5 (permutation test, p < 0.05).

Similar articles

Cited by

References

    1. Fernandez C, Goldberg JM. Physiology of peripheral neurons innervating semicircular canals of the squirrel monkey. II. Response to sinusoidal stimulation and dynamics of peripheral vestibular system. J Neurophysiol. 1971;34:661–675. - PubMed
    1. Fernandez C, Goldberg JM. Physiology of peripheral neurons innervating otolith organs of the squirrel monkey. II. Directional selectivity and force-response relations. J Neurophysiol. 1976;39:985–995. - PubMed
    1. Angelaki DE, Hess BJ. Self-motion-induced eye movements: effects on visual acuity and navigation. Nat Rev Neurosci. 2005;6:966–976. - PubMed
    1. Raphan T, Cohen B. The vestibulo-ocular reflex in three dimensions. Exp Brain Res. 2002;145:1–27. - PubMed
    1. Nashner LM. Adapting reflexes controlling the human posture. Exp Brain Res. 1976;26:59–72. - PubMed

Publication types