Review
. 2007:161:419-33.
doi: 10.1016/S0079-6123(06)61030-3.

Remyelination of the injured spinal cord

Affiliations
Review

Remyelination of the injured spinal cord

Masanori Sasaki et al. Prog Brain Res. 2007.

Abstract

Contusive spinal cord injury (SCI) can result in necrosis of the spinal cord, but often long white matter tracts outside of the central necrotic core are demyelinated. One experimental strategy to improve functional outcome following SCI is to transplant myelin-forming cells to remyelinate these axons and improve conduction. This review focuses on transplantation studies using olfactory ensheathing cell (OEC) to improve functional outcome in experimental models of SCI and demyelination. The biology of the OEC, and recent experimental research and clinical studies using OECs as a potential cell therapy candidate are discussed.


Figures

Fig. 1
Fig. 1
Light micrographs of transverse sections of the dorsal spinal cord stained with methylene blue/azure II showing the dorsal funiculus in demyelinated (A) and OEC transplanted (B) rats. Examination at higher magnification show demyelinated (A2, A3) and remyelinated (B2, B3) axons in the dorsal columns. Note the extensive myelination after transplantation of OEC (B). Many myelin-forming cells were similar to peripheral myelin-forming cells, characterized by large nuclear and cytoplasmic regions (B3). A2, B2 and A3, B3 were prepared from the boxed area in A1, B1 and A2, B2 respectively. Immuno-EM for GFP shows numerous GFP+ cells remyelinating the demyelinated axons (C, D). Counterstaining for these sections was minimal, and dark staining shows electron dense immunoperoxidase reaction product. Note the electron dense reaction product in the cytoplasm and nuclei of most cells forming myelin (C, D). One cell associated with myelin in this field displays distinct reaction product, whereas an adjacent cell does not have electron dense reaction product in its cytoplasm (D1). D2 is an enlargement of the box in D1. Note the dense reaction product in the cytoplasm of the myelin-forming cell on the right and the basement membrane surrounding the cell. Scale bars = 700 μm (A1, B1); 70 μm (A2, B2); 1 μm (A3, B3); 5 μm (C); 2 μm (D1); 0.4 (D2). C and D are modified with permission from Sasaki et al. (2006a).
Fig. 2
Fig. 2
Sagittal frozen sections through the lesion site demonstrate the distribution of transplanted GFP-OEC. Transplanted cells are primarily confined to the lesion site. Some cells migrated into the deep white matter. The dashed line demarcates lesion edge (A). Coronal frozen sections in the lesion show the presence of GFP-OEC within a lesion site. Transplanted cells survived primarily in the dorsal funiculus. There was little GFAP staining within the lesion zone (B). GFAP-positive cells were present at the peripheral margin of the lesion. These results indicate that few astrocytes are present in the transplant region, and that there is a preponderance of GFP-OEC in the lesion zone (B, C). P0-immunostaining (red) of the frozen coronal section reveals that most axons remyelinated by the transplanted OECs are surrounded by peripheral type of myelin. Red-P0 rings are associated with green cellular elements, indicating that transplanted OECs remyelinate the demyelinated axons (D). Expansion of a cell indicated by an arrow (D inset). P0 and neurofilament (NF) staining at lesion boundary (dashed line) and transplant zone (E). Higher magnification showing neurofilament-defined axon cores surrounded by P0 myelin rings enwrapped by GFP-OECs (E2). B–E are coronal. Scale bars: 1 mm (A); 400 μm (B); 30 μm (C); 10 μm (D); 20 μm (A, inset); 10 μm (B, inset); 30 μm (E1); 10 μm (E2); 2.5 μm (E2, inset). Modified with permission from Sasaki et al. (2006a).
Fig. 3
Fig. 3
Nodal structure of remyelinated axons (A, B) at 3 weeks after OEC transplantation. Sagittal section showing a field of myelinated axons interspersed among donor OECs. Note the node structure in the center of the field (A). High-power electron micrograph showing node and paranodal loops (B1). B2 is an enlargement of the boxed area in B1. Scale bars = 5 μm (A); 1 μm (B1); 0.5 μm (B2). Modified with permission from Sasaki et al. (2006a).
Fig. 4
Fig. 4
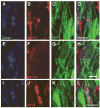
Nav1.2 and Nav1.6 at GFP-OEC nodes in remyelinated dorsal columns. At 3 weeks after transplantation, Nav1.6 clustering is displayed at most Caspr-delimited (A–D) nodes formed by GFP-OECs at 3 weeks. In contrast, Caspr-delimited nodes formed by GFP-OECs do not exhibit Nav1.2 immunostaining (E–H). Merged images of A–C and E–G are shown in D and H, respectively. Juxta-paranodal Kv1.2 immunolabeling at 3 weeks after GFP-OEC transplantation dorsal columns. Paranodes display Caspr staining (I) that is flanked by Kv1.2 aggregations within juxtaparanodal regions. Merged images of I–K are shown in L, respectively. Scale bars = 10 μm. Modified with permission from Sasaki et al. (2006a).
Fig. 5
Fig. 5
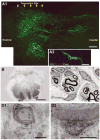
Montage image of sagittal frozen section showing distribution of GFP-OECs within and beyond the transection site (A). Semithin plastic sections stained with methylene blue/Azure II through the transection site 5 weeks after transplantation of OECs. Low-power micrograph showing completeness of the transection through the entire dorsal funiculus and beyond (B). EM from the same lesion showing myelinated axons surrounded by a cellular element forming a tunnel (C). EM of anti-GFP immunoperoxidase staining of OEC transplant (D). Reaction product can be seen in cytoplasmic regions of the myelin-forming cell but not in the myelin. A crosscut section of axon showing cytoplastic reaction product. Enlargement of the boxed area is shown in D2. Note the presence of extracellular fibrous elements in D1. Scale bars = 250 μm (A); 0.75 μm (B); 5 μm (C); 1 μm (D1); 0.25 μm (D2). Modified with permission from Sasaki et al. (2004).
Fig. 6
Fig. 6
Open-field locomotor scores for OEC transplant (n = 20) and sham injection (n = 6) groups tested 1 week before and for 5 weeks after transplantation. Modified with permission from Sasaki et al. (2004).
Fig. 7
Fig. 7
Hoechst 33342, Fluorogold (FG), and TUNEL triple labeling of corticospinal neurons 1 week after injury. Hoechst staining of non-TUNEL-positive (arrows with tails) and TUNEL-positive (arrowheads) neurons with corresponding FG-backfilling are shown. In SCI+FG+OEC animals (B), fewer TUNEL-positive FG-backfilled neurons are observed compared with SCI+FG+DMEM (A). Insets in A show two TUNEL-positive neurons exhibiting nuclear compartmentalization and formation of nucleosomes, hallmarks of apoptosis. Quantification of neurons that are both TUNEL- and FG-positive (C) reveals that OEC transplantation significantly (*P<0.05) reduces apoptotic cell death at 1 week. No evidence of death was observed at any other time-point. Scale bars = 125 μm in A, B; 20 μm in inset in A. Modified with permission from Sasaki et al. (2006b).
Fig. 8
Fig. 8
Distribution of transplanted OECs into a contused rat spinal cord (A). Sagittal section of a segment of the spinal cord ~8 mm rostral and caudal to the injured area showed transplanted OECs concentrated near the center and distributed along the longitudinal axes of the spinal cord at 3 weeks after transplantation (A), arrows indicated transplantation points. A2 and A3 are enlargements of boxed areas in A1. Immuno EM for GFP revealed that many detectable GFP+ cells were in direct contact with host axons (Arrows). Reaction product was clearly evident in the cytoplasm of many cells that formed well-defined multi-laminate structures characteristic of myelin at 4 weeks after transplantation (8B, C). Scale bars = 1 mm (A1); 100 μm (A2, A3); 5 μm (B); 1 μm (C).

Similar articles

Cited by

References

    1. Au E, Roskams AJ. Olfactory ensheathing cells of the lamina propria in vivo and in vitro. Glia. 2003;41:224–236. - PubMed
    1. Bareyre FM, Kerschensteiner M, Raineteau O, Mettenleiter TC, Weinmann O, Schwab ME. The injured spinal cord spontaneously forms a new intraspinal circuit in adult rats. Nat Neurosci. 2004;10:269–277. - PubMed
    1. Barnett SC, Alexander CL, Iwashita Y, Gilson JM, Crowther J, Clark L, Dunn LT, Papanastassiou V, Kennedy PG, Franklin RJ. Identification of a human olfactory ensheathing cell that can effect transplant-mediated remyelination of demyelinated CNS axons. Brain. 2000;123:1581–1588. - PubMed
    1. Basso DM, Beattie MS, Bresnahan JC. A sensitive and reliable locomotor rating scale for open field testing in rats. J Neurotrauma. 1995;12:1–21. - PubMed
    1. Blakemore WF, Crang AJ. The use of cultured autologous Schwann cells to remyelinate areas of persistent demyelination in the central nervous system. J Neurol Sci. 1985;70:207–223. - PubMed

Publication types