. 2007 Aug;97(2):173-94.
doi: 10.1007/s00422-007-0166-0. Epub 2007 Jul 7.

Studies of stimulus parameters for seizure disruption using neural network simulations

Affiliations

Studies of stimulus parameters for seizure disruption using neural network simulations

William S Anderson et al. Biol Cybern. 2007 Aug.

Abstract

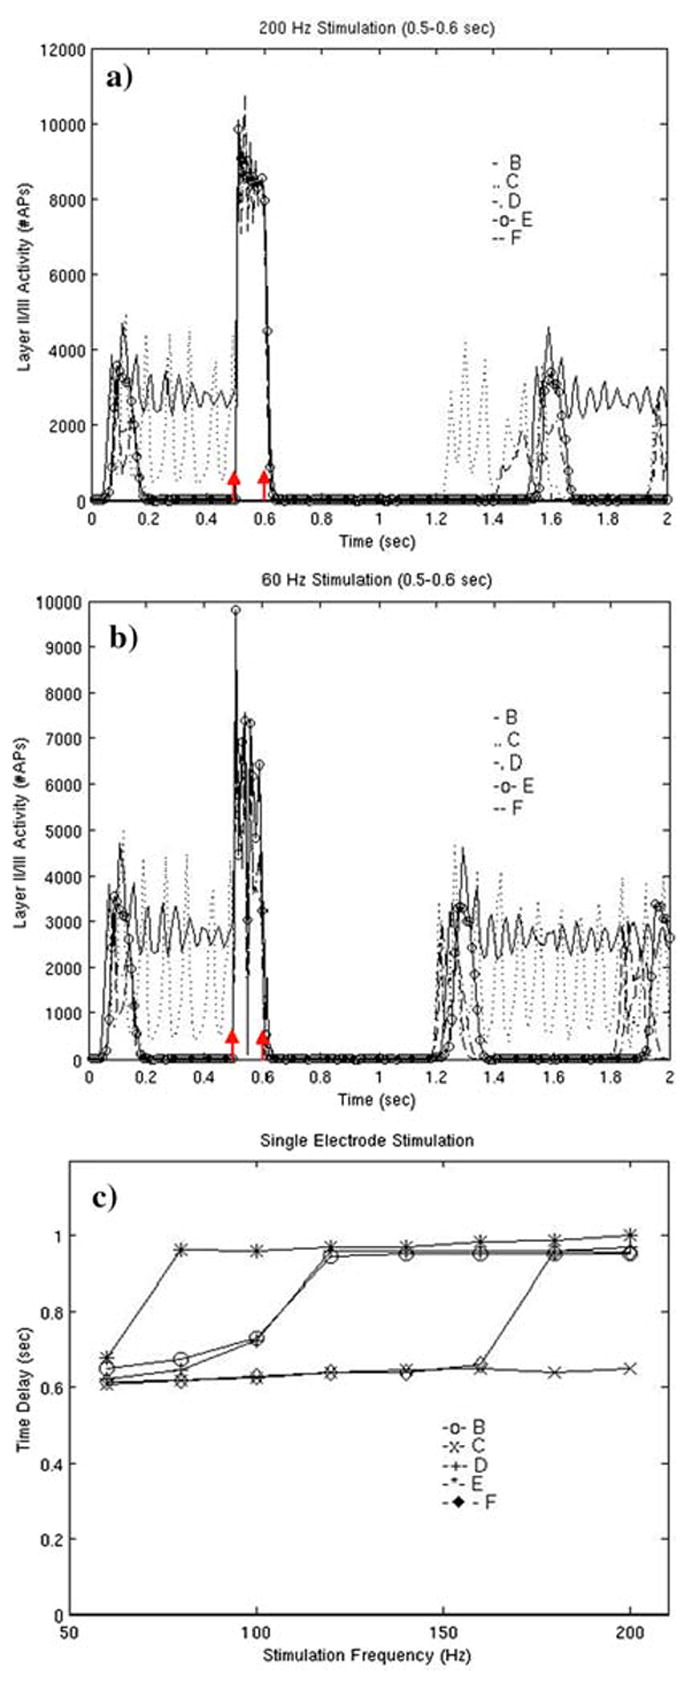
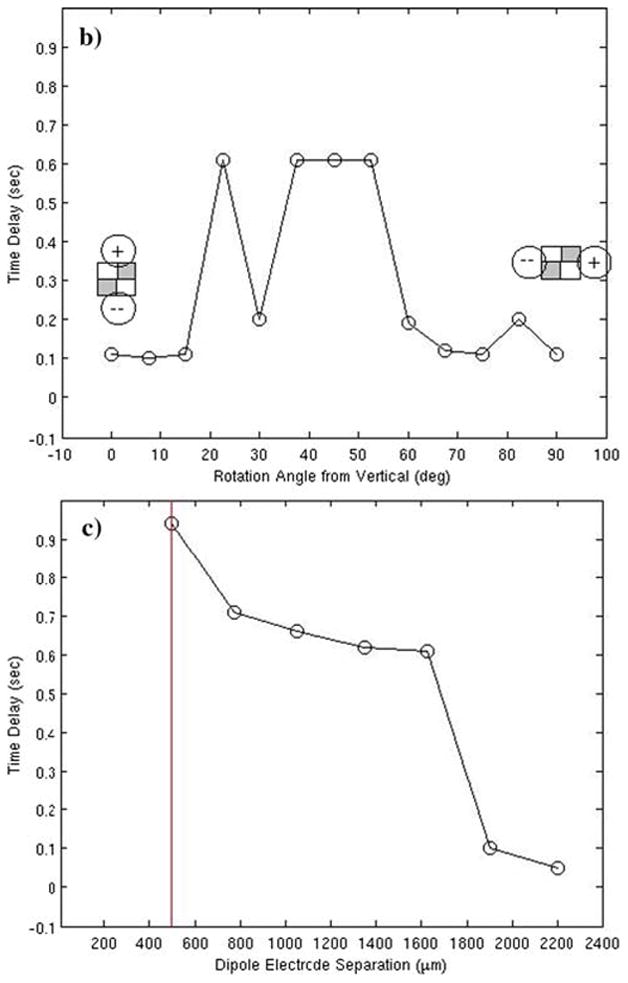
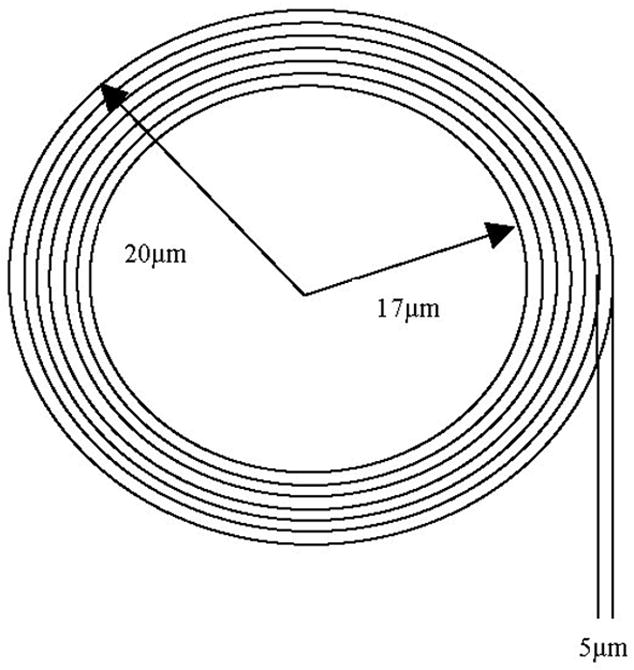
A large scale neural network simulation with realistic cortical architecture has been undertaken to investigate the effects of external electrical stimulation on the propagation and evolution of ongoing seizure activity. This is an effort to explore the parameter space of stimulation variables to uncover promising avenues of research for this therapeutic modality. The model consists of an approximately 800 mum x 800 mum region of simulated cortex, and includes seven neuron classes organized by cortical layer, inhibitory or excitatory properties, and electrophysiological characteristics. The cell dynamics are governed by a modified version of the Hodgkin-Huxley equations in single compartment format. Axonal connections are patterned after histological data and published models of local cortical wiring. Stimulation induced action potentials take place at the axon initial segments, according to threshold requirements on the applied electric field distribution. Stimulation induced action potentials in horizontal axonal branches are also separately simulated. The calculations are performed on a 16 node distributed 32-bit processor system. Clear differences in seizure evolution are presented for stimulated versus the undisturbed rhythmic activity. Data is provided for frequency dependent stimulation effects demonstrating a plateau effect of stimulation efficacy as the applied frequency is increased from 60 to 200 Hz. Timing of the stimulation with respect to the underlying rhythmic activity demonstrates a phase dependent sensitivity. Electrode height and position effects are also presented. Using a dipole stimulation electrode arrangement, clear orientation effects of the dipole with respect to the model connectivity is also demonstrated. A sensitivity analysis of these results as a function of the stimulation threshold is also provided.


Figures

Figure 1
Figure 1
Single neuron simulations using modified Hodgkin-Huxley equations with calcium diffusion. A 5 μA internal current injection is used to excite the cells, and the current source is shut-off at 250 msec to demonstrate the lack of self-excitatory behavior in each of the three cell-types. a) Regular spiking cell. b) Intrinsic bursting cell. c) Fast spiking cell. Table 3. presents the parameters for these three cell types.
Figure 2
Figure 2
(a–c) Schematic diagram of the types of neurons within the simulation as well as their intrinsic connectivity within a minicolumn (darker shaded lines) and their local connectivity to neighboring neurons within other minicolumns (lighter shaded lines). d) Spatial size scale of axonal arborization pattern from a representative layer II/III.
Figure 3
Figure 3
Snapshots of network activity for all seven cell classes as a function of time. Connectivity pattern C. Stimulation occurs from 0.5 to 0.6 sec. Classes 1–4 represent layer II/III pyramidal cells, stellate cells, and layer V and layer VI pyramidal cells respectively. Classes 5–7 represent basket cells, double bouquet cells, and chandelier cells respectively.
Figure 4
Figure 4
Stimulation effects as a function of frequency and connectivity pattern. These plots demonstrate the time evolution of network activity with a constant central noise source present. Stimulation occurs from 0.5 sec to 0.6 sec (red arrows). The time delay to return of activity is defined as the time after 0.6 sec at which the first peak in the layer II/III network activity occurs. a) layer II/III pyramidal cell activity with stimulation at 200 Hz. b) layer II/III pyramidal cell activity with stimulation at 60 Hz. c) Delay to return of activity (layer II/III pyramidal cells) as a function of frequency for the tested connectivity patterns (B–F).
Figure 5
Figure 5
Stimulation effects as a function of electrode position parallel to the cortical surface. The time to return of activity (layer II/III pyramidal cells) is plotted as a function of the stimulation electrodes distance from the center of the network for a variety of connectivity patterns. The pattern B data was continued through the center of the model to show the approximate dimension of the active central ring of stimulation under the electrode.
Figure 6
Figure 6
Stimulation effects as a function of height above the cortex for the tested connectivity patterns (A–F) (layer II/III pyramidal cells). The single vertical red line marks the cortical surface.
Figure 7
Figure 7
(a) Study of the influence of stimulation on longer range patch connections in the network. Two opposite corners of the network, specifically between layer II/III pyramidal cells in each patch, and between layer V pyramidal cells in each patch, are preferentially connected. Stimulation is via the dipole electrode arrangement, and the plots of layer II/III pyramidal cell activity are presented as a function of the dipole orientation. Stronger stimulation induced effects are observed with the dipole axis parallel to the connected patches. The connected patches are shaded gray in the schematic, and the two dipole disks are represented as circles around the periphery of the model. Red arrows mark the onset and cessation of stimulation (Connectivity pattern C). The dipole marked with the ‘+’ sign undergoes the positive lobe of stimulation first, the ‘−‘ electrode is switched in polarity. The figure should be read from left to right in a given row, the dipole is rotated in the clockwise direction around the model. (b) Close up view of the time delay as a function of dipole rotation angle taken between the “0” orientation presented in the inset on the left side of the figure, and the “90” orientation shown on the right side. (c) Time delay dependence on the separation of the two electrodes, with the dipole system oriented along the connected patches. The red line marks the point of contact of the two electrodes.
Figure 7
Figure 7
(a) Study of the influence of stimulation on longer range patch connections in the network. Two opposite corners of the network, specifically between layer II/III pyramidal cells in each patch, and between layer V pyramidal cells in each patch, are preferentially connected. Stimulation is via the dipole electrode arrangement, and the plots of layer II/III pyramidal cell activity are presented as a function of the dipole orientation. Stronger stimulation induced effects are observed with the dipole axis parallel to the connected patches. The connected patches are shaded gray in the schematic, and the two dipole disks are represented as circles around the periphery of the model. Red arrows mark the onset and cessation of stimulation (Connectivity pattern C). The dipole marked with the ‘+’ sign undergoes the positive lobe of stimulation first, the ‘−‘ electrode is switched in polarity. The figure should be read from left to right in a given row, the dipole is rotated in the clockwise direction around the model. (b) Close up view of the time delay as a function of dipole rotation angle taken between the “0” orientation presented in the inset on the left side of the figure, and the “90” orientation shown on the right side. (c) Time delay dependence on the separation of the two electrodes, with the dipole system oriented along the connected patches. The red line marks the point of contact of the two electrodes.
Figure 8
Figure 8
Study of action potential production in the horizontal axonal branches as a function of frequency, solely in the monopolar format. Summed network activity for the layer II/III pyramidal cells is demonstrated as a function of time. Action potential production in the axon initial segment was ignored. Red arrows mark the onset and cessation of stimulation. Note the time-frequency alteration of this couplet bursting mode after stimulation (Connectivity pattern C).
Figure 9
Figure 9
Patch connected study using the dipole electrode configuration (1mm diameter electrodes separated by 1.6 mm). The horizontal axon branch action potential requirements are used to determine the stimulated branches. Very little delay is observed for the return of the underlying layer II/III pyramidal cell activity. Red arrows mark the onset and cessation of stimulation (Connectivity pattern C). The dipole marked with the ‘+’ sign undergoes the positive lobe of stimulation first, the ‘−‘ electrode is switched in polarity. The figure should be read from left to right in a given row, the dipole is rotated in the clockwise direction around the model.
Figure 10
Figure 10
Study of timing of single pulse stimulation with respect to the underlying network rhythmicity, as demonstrated by the connectivity pattern C design. Time to return of layer II/III pyramidal cell activity as a function of delay time relative to the network peak activity peak is shown in A. A red line and arrow mark the stimulation point. The plots of network activity for each stimulation time are presented in B, demonstrating the phase sensitive alterations in post-stimulation network activity.
Figure 10
Figure 10
Study of timing of single pulse stimulation with respect to the underlying network rhythmicity, as demonstrated by the connectivity pattern C design. Time to return of layer II/III pyramidal cell activity as a function of delay time relative to the network peak activity peak is shown in A. A red line and arrow mark the stimulation point. The plots of network activity for each stimulation time are presented in B, demonstrating the phase sensitive alterations in post-stimulation network activity.
Figure 11
Figure 11
Sensitivity of stimulation effects to threshold requirement on characteristic function, Δ2V. Plot is for monopolar stimulation at 200 Hz with fixed electrode position relative to the network. Time to return of activity (layer II/III pyramidal cells) is plotted as a function of the threshold value in mV.
Figure 12
Figure 12
Time to return of activity (layer II/III pyramidal cells) as a function of height for pattern C connectivity given a Gaussian distribution for the characteristic function threshold condition. In this example, the mean threshold for axon initial segment stimulation is 2 mV, and the Gaussian has a standard deviation of 1 mV. The single vertical red line marks the cortical surface.
Figure 13
Figure 13
(a) Time to return of activity (layer II/III pyramidal cells) for pattern C connectivity, keeping the quantity EI2 ·Npulses constant at (10 mA)2 ×(6 pulses) as the applied stimulation frequency is varied as a measure of applied stimulation energy. Stimulation starts at 0.5 sec for a 2 sec run. (b) Time to return of activity (layer II/III pyramidal cells) for pattern C connectivity, keeping the quantity EI2 ·Npulses constant at (600 mA2) by varying the stimulation current, and number of stimulation pulses. Total stimulation time is 0.1 sec starting at 0.5 sec for a 2 sec run. The stimulation current is also plotted. (c) Time to return of activity (layer II/III pyramidal cells) for pattern C connectivity, simply as a function of stimulation current for 200 Hz stimulation from 0.5 to 0.6 sec in a 2 sec run.
Figure 14
Figure 14
Diagram of shell structure used to model the [Ca2+] diffusion with the relative sizes of the simulated shells demonstrated.

Similar articles

Cited by

References

    1. Anderson WS. For original C codes of the neural network simulation, and for MPEGs of the network activity, the contact email is wanderso@jhmi.edu.

    1. Atkinson WJ, Young JH, Brezovich IA. An analytic solution for the potential due to a circular parallel plate capacitor. J Phys A: Math Gen. 1983;16:2837–2841.
    1. Av-Ron E. The role of a transient potassium current in a bursting neuron model. J Math Biol. 1994;33:71–87. - PubMed
    1. Av-Ron E, Parnas H, Segel LA. A basic biophysical model for bursting neurons. Biol Cybern. 1993;69:87–95. - PubMed
    1. Bao W, Wu J-Y. Propagating wave and irregular dynamics: spatiotemporal patterns of cholinergic theta oscillations in neocortex in vitro. J Neurophys. 2003;90:333–341. - PMC - PubMed

Publication types

MeSH terms