. 2007 Jul 9:7:110.
doi: 10.1186/1471-2148-7-110.

Collective properties of evolving molecular quasispecies

Affiliations

Collective properties of evolving molecular quasispecies

Michael Stich et al. BMC Evol Biol. .

Abstract

Background: RNA molecules, through their dual appearance as sequence and structure, represent a suitable model to study evolutionary properties of quasispecies. The essential ingredient in this model is the differentiation between genotype (molecular sequences which are affected by mutation) and phenotype (molecular structure, affected by selection). This framework allows a quantitative analysis of organizational properties of quasispecies as they adapt to different environments, such as their robustness, the effect of the degeneration of the sequence space, or the adaptation under different mutation rates and the error threshold associated.

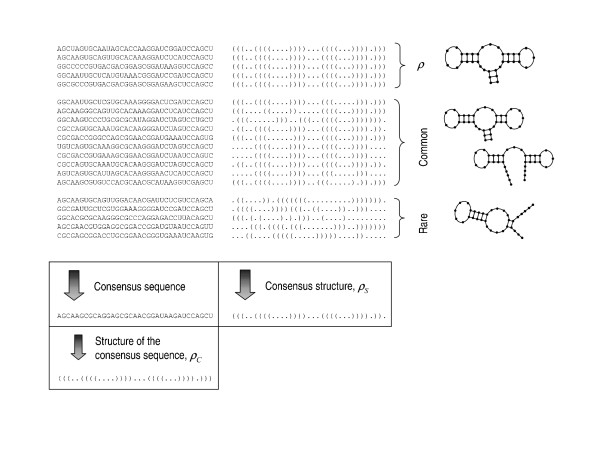
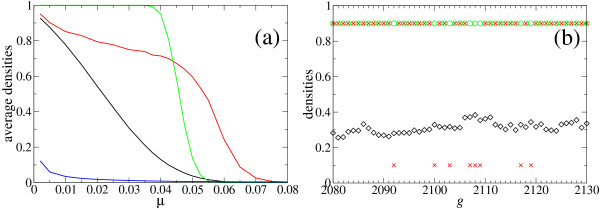
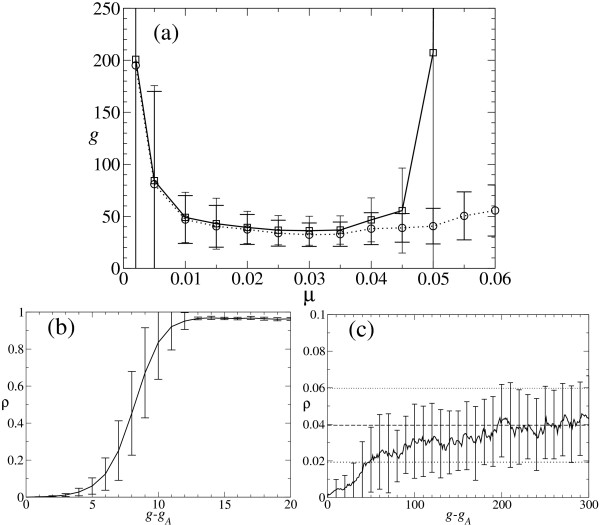
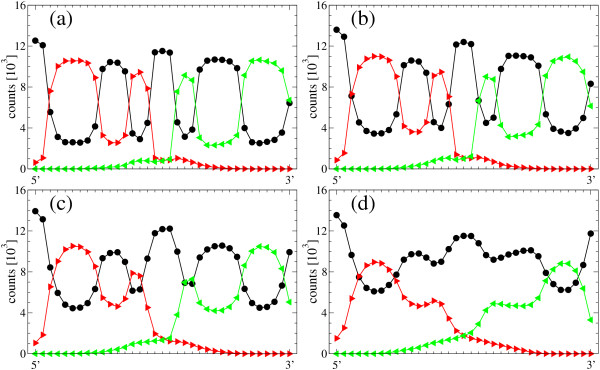
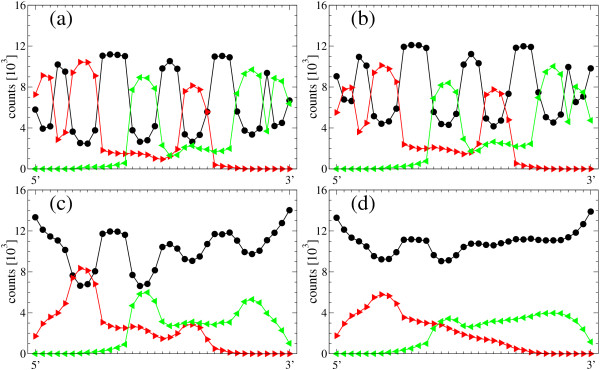
Results: We describe and analyze the structural properties of molecular quasispecies adapting to different environments both during the transient time before adaptation takes place and in the asymptotic state, once optimization has occurred. We observe a minimum in the adaptation time at values of the mutation rate relatively far from the phenotypic error threshold. Through the definition of a consensus structure, it is shown that the quasispecies retains relevant structural information in a distributed fashion even above the error threshold. This structural robustness depends on the precise shape of the secondary structure used as target of selection. Experimental results available for natural RNA populations are in qualitative agreement with our observations.

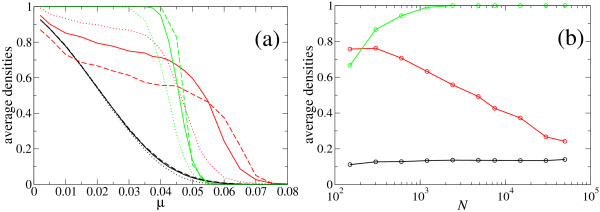
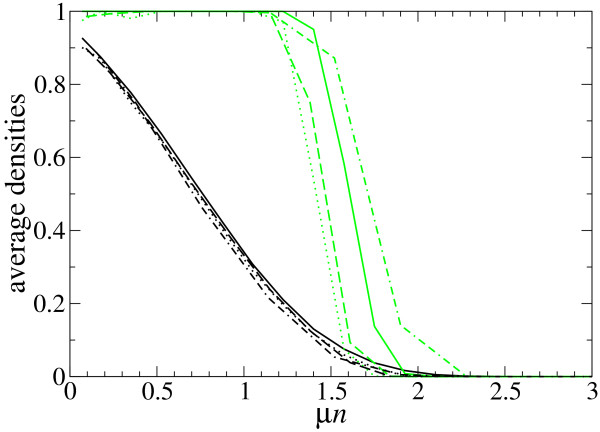
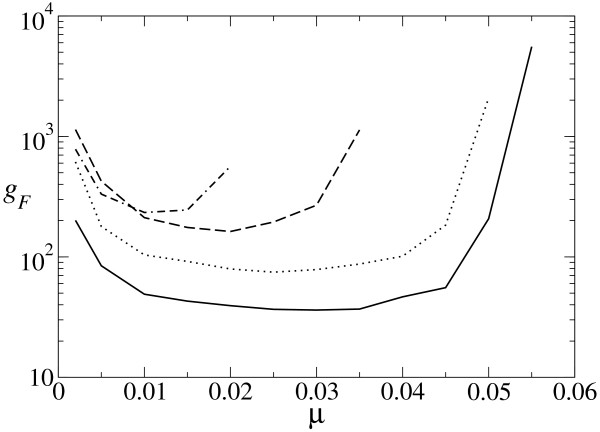
Conclusion: Adaptation time of molecular quasispecies to a given environment is optimized at values of the mutation rate well below the phenotypic error threshold. The optimal value results from a trade-off between diversity generation and fixation of advantageous mutants. The critical value of the mutation rate is a function not only of the sequence length, but also of the specific properties of the environment, in this case the selection pressure and the shape of the secondary structure used as target phenotype. Certain functional motifs of RNA secondary structure that withstand high mutation rates (as the ubiquitous hairpin motif) might appear early in evolution and be actually frozen evolutionary accidents.


Figures

Figure 1
Figure 1
Heterogeneity of sequences and structures, and quantities related. Examples of RNA sequences (written in 5'-3' orientation) and their corresponding structures in bracket notation at the statistically stationary state of a numerical simulation with N = 602, n = 35, μ = 0.0325. The probability that a sequence folds into the target structure (a hammerhead structure, represented in the upper right corner) is ρ¯ MathType@MTEF@5@5@+=feaafiart1ev1aaatCvAUfKttLearuWrP9MDH5MBPbIqV92AaeXatLxBI9gBaebbnrfifHhDYfgasaacH8akY=wiFfYdH8Gipec8Eeeu0xXdbba9frFj0=OqFfea0dXdd9vqai=hGuQ8kuc9pgc9s8qqaq=dirpe0xb9q8qiLsFr0=vr0=vr0dc8meaabaqaciaacaGaaeqabaqabeGadaaakeaaiiGacuWFbpGCgaqeaaaa@2E8B@ = 0.25. Other densities are ρ¯ MathType@MTEF@5@5@+=feaafiart1ev1aaatCvAUfKttLearuWrP9MDH5MBPbIqV92AaeXatLxBI9gBaebbnrfifHhDYfgasaacH8akY=wiFfYdH8Gipec8Eeeu0xXdbba9frFj0=OqFfea0dXdd9vqai=hGuQ8kuc9pgc9s8qqaq=dirpe0xb9q8qiLsFr0=vr0=vr0dc8meaabaqaciaacaGaaeqabaqabeGadaaakeaaiiGacuWFbpGCgaqeaaaa@2E8B@C = 0.85, ρ¯ MathType@MTEF@5@5@+=feaafiart1ev1aaatCvAUfKttLearuWrP9MDH5MBPbIqV92AaeXatLxBI9gBaebbnrfifHhDYfgasaacH8akY=wiFfYdH8Gipec8Eeeu0xXdbba9frFj0=OqFfea0dXdd9vqai=hGuQ8kuc9pgc9s8qqaq=dirpe0xb9q8qiLsFr0=vr0=vr0dc8meaabaqaciaacaGaaeqabaqabeGadaaakeaaiiGacuWFbpGCgaqeaaaa@2E8B@S = 0.99, and ρ¯ MathType@MTEF@5@5@+=feaafiart1ev1aaatCvAUfKttLearuWrP9MDH5MBPbIqV92AaeXatLxBI9gBaebbnrfifHhDYfgasaacH8akY=wiFfYdH8Gipec8Eeeu0xXdbba9frFj0=OqFfea0dXdd9vqai=hGuQ8kuc9pgc9s8qqaq=dirpe0xb9q8qiLsFr0=vr0=vr0dc8meaabaqaciaacaGaaeqabaqabeGadaaakeaaiiGacuWFbpGCgaqeaaaa@2E8B@M = 0.01. At the time step chosen, the structure of the consensus sequence and the consensus structure differ in one position, and the latter does not correspond to any real secondary RNA structure (a very rare event in the asymptotic regime, but shown here for illustration). The Hamming distance between the sequences shown and the consensus sequence varies from 8 to 15, and does not show any significant difference whether the sequence folds into the target structure or whether the corresponding structure is rare (last group). Despite a well defined global state where the population, as a whole, clearly contains all the information on the target structure, both the density of sequences folding into it and especially the density of the most abundant sequence present low values.
Figure 2
Figure 2
Average values of population densities as function of μ and typical dynamical behavior. (a) Values of the average density ρ¯ MathType@MTEF@5@5@+=feaafiart1ev1aaatCvAUfKttLearuWrP9MDH5MBPbIqV92AaeXatLxBI9gBaebbnrfifHhDYfgasaacH8akY=wiFfYdH8Gipec8Eeeu0xXdbba9frFj0=OqFfea0dXdd9vqai=hGuQ8kuc9pgc9s8qqaq=dirpe0xb9q8qiLsFr0=vr0=vr0dc8meaabaqaciaacaGaaeqabaqabeGadaaakeaaiiGacuWFbpGCgaqeaaaa@2E8B@ (black curve) of sequences folding into the target structure (hairpin), of the probability ρ¯ MathType@MTEF@5@5@+=feaafiart1ev1aaatCvAUfKttLearuWrP9MDH5MBPbIqV92AaeXatLxBI9gBaebbnrfifHhDYfgasaacH8akY=wiFfYdH8Gipec8Eeeu0xXdbba9frFj0=OqFfea0dXdd9vqai=hGuQ8kuc9pgc9s8qqaq=dirpe0xb9q8qiLsFr0=vr0=vr0dc8meaabaqaciaacaGaaeqabaqabeGadaaakeaaiiGacuWFbpGCgaqeaaaa@2E8B@C (red line) that the consensus sequence folds into the target structure, of the probability ρ¯ MathType@MTEF@5@5@+=feaafiart1ev1aaatCvAUfKttLearuWrP9MDH5MBPbIqV92AaeXatLxBI9gBaebbnrfifHhDYfgasaacH8akY=wiFfYdH8Gipec8Eeeu0xXdbba9frFj0=OqFfea0dXdd9vqai=hGuQ8kuc9pgc9s8qqaq=dirpe0xb9q8qiLsFr0=vr0=vr0dc8meaabaqaciaacaGaaeqabaqabeGadaaakeaaiiGacuWFbpGCgaqeaaaa@2E8B@S (green line) that the consensus structure coincides with the target structure, and of the fraction ρ¯ MathType@MTEF@5@5@+=feaafiart1ev1aaatCvAUfKttLearuWrP9MDH5MBPbIqV92AaeXatLxBI9gBaebbnrfifHhDYfgasaacH8akY=wiFfYdH8Gipec8Eeeu0xXdbba9frFj0=OqFfea0dXdd9vqai=hGuQ8kuc9pgc9s8qqaq=dirpe0xb9q8qiLsFr0=vr0=vr0dc8meaabaqaciaacaGaaeqabaqabeGadaaakeaaiiGacuWFbpGCgaqeaaaa@2E8B@M (blue line) of the most abundant sequence in the population. Population size is N = 602; averages over 4000 generations and 25 realizations have been performed. (b) Temporal dynamics (interval of 50 generations starting at generation 2080 after initialization of a single run) of ρ (black diamonds), ρC (red crosses), and ρS (green circles) for μ = 0.030. Average values are ρ¯ MathType@MTEF@5@5@+=feaafiart1ev1aaatCvAUfKttLearuWrP9MDH5MBPbIqV92AaeXatLxBI9gBaebbnrfifHhDYfgasaacH8akY=wiFfYdH8Gipec8Eeeu0xXdbba9frFj0=OqFfea0dXdd9vqai=hGuQ8kuc9pgc9s8qqaq=dirpe0xb9q8qiLsFr0=vr0=vr0dc8meaabaqaciaacaGaaeqabaqabeGadaaakeaaiiGacuWFbpGCgaqeaaaa@2E8B@ = 0.323, ρ¯ MathType@MTEF@5@5@+=feaafiart1ev1aaatCvAUfKttLearuWrP9MDH5MBPbIqV92AaeXatLxBI9gBaebbnrfifHhDYfgasaacH8akY=wiFfYdH8Gipec8Eeeu0xXdbba9frFj0=OqFfea0dXdd9vqai=hGuQ8kuc9pgc9s8qqaq=dirpe0xb9q8qiLsFr0=vr0=vr0dc8meaabaqaciaacaGaaeqabaqabeGadaaakeaaiiGacuWFbpGCgaqeaaaa@2E8B@C = 0.749, ρ¯ MathType@MTEF@5@5@+=feaafiart1ev1aaatCvAUfKttLearuWrP9MDH5MBPbIqV92AaeXatLxBI9gBaebbnrfifHhDYfgasaacH8akY=wiFfYdH8Gipec8Eeeu0xXdbba9frFj0=OqFfea0dXdd9vqai=hGuQ8kuc9pgc9s8qqaq=dirpe0xb9q8qiLsFr0=vr0=vr0dc8meaabaqaciaacaGaaeqabaqabeGadaaakeaaiiGacuWFbpGCgaqeaaaa@2E8B@S = 1.0. For better visualization of the values of ρC and ρS, the values corresponding to 1 are drawn on the line 0.9 and the values corresponding to 0 are drawn on the line 0.1.
Figure 3
Figure 3
Densities as a function of the mutation rate μ and the population size N. (a) Curves for ρ¯ MathType@MTEF@5@5@+=feaafiart1ev1aaatCvAUfKttLearuWrP9MDH5MBPbIqV92AaeXatLxBI9gBaebbnrfifHhDYfgasaacH8akY=wiFfYdH8Gipec8Eeeu0xXdbba9frFj0=OqFfea0dXdd9vqai=hGuQ8kuc9pgc9s8qqaq=dirpe0xb9q8qiLsFr0=vr0=vr0dc8meaabaqaciaacaGaaeqabaqabeGadaaakeaaiiGacuWFbpGCgaqeaaaa@2E8B@ (black lines), ρ¯ MathType@MTEF@5@5@+=feaafiart1ev1aaatCvAUfKttLearuWrP9MDH5MBPbIqV92AaeXatLxBI9gBaebbnrfifHhDYfgasaacH8akY=wiFfYdH8Gipec8Eeeu0xXdbba9frFj0=OqFfea0dXdd9vqai=hGuQ8kuc9pgc9s8qqaq=dirpe0xb9q8qiLsFr0=vr0=vr0dc8meaabaqaciaacaGaaeqabaqabeGadaaakeaaiiGacuWFbpGCgaqeaaaa@2E8B@C (red lines), and ρ¯ MathType@MTEF@5@5@+=feaafiart1ev1aaatCvAUfKttLearuWrP9MDH5MBPbIqV92AaeXatLxBI9gBaebbnrfifHhDYfgasaacH8akY=wiFfYdH8Gipec8Eeeu0xXdbba9frFj0=OqFfea0dXdd9vqai=hGuQ8kuc9pgc9s8qqaq=dirpe0xb9q8qiLsFr0=vr0=vr0dc8meaabaqaciaacaGaaeqabaqabeGadaaakeaaiiGacuWFbpGCgaqeaaaa@2E8B@S (green lines) as a function of the mutation rate for different values of the population size N. Dotted lines denote N = 150, solid lines N = 602, and dashed lines N = 2408. The density of correctly folded sequences ρ¯ MathType@MTEF@5@5@+=feaafiart1ev1aaatCvAUfKttLearuWrP9MDH5MBPbIqV92AaeXatLxBI9gBaebbnrfifHhDYfgasaacH8akY=wiFfYdH8Gipec8Eeeu0xXdbba9frFj0=OqFfea0dXdd9vqai=hGuQ8kuc9pgc9s8qqaq=dirpe0xb9q8qiLsFr0=vr0=vr0dc8meaabaqaciaacaGaaeqabaqabeGadaaakeaaiiGacuWFbpGCgaqeaaaa@2E8B@ and the probability ρ¯ MathType@MTEF@5@5@+=feaafiart1ev1aaatCvAUfKttLearuWrP9MDH5MBPbIqV92AaeXatLxBI9gBaebbnrfifHhDYfgasaacH8akY=wiFfYdH8Gipec8Eeeu0xXdbba9frFj0=OqFfea0dXdd9vqai=hGuQ8kuc9pgc9s8qqaq=dirpe0xb9q8qiLsFr0=vr0=vr0dc8meaabaqaciaacaGaaeqabaqabeGadaaakeaaiiGacuWFbpGCgaqeaaaa@2E8B@S that the consensus structure coincides with the target structure converge to limit curves as N increases. The probability ρ¯ MathType@MTEF@5@5@+=feaafiart1ev1aaatCvAUfKttLearuWrP9MDH5MBPbIqV92AaeXatLxBI9gBaebbnrfifHhDYfgasaacH8akY=wiFfYdH8Gipec8Eeeu0xXdbba9frFj0=OqFfea0dXdd9vqai=hGuQ8kuc9pgc9s8qqaq=dirpe0xb9q8qiLsFr0=vr0=vr0dc8meaabaqaciaacaGaaeqabaqabeGadaaakeaaiiGacuWFbpGCgaqeaaaa@2E8B@C depends strongly on N. (b) Dependence of ρ¯ MathType@MTEF@5@5@+=feaafiart1ev1aaatCvAUfKttLearuWrP9MDH5MBPbIqV92AaeXatLxBI9gBaebbnrfifHhDYfgasaacH8akY=wiFfYdH8Gipec8Eeeu0xXdbba9frFj0=OqFfea0dXdd9vqai=hGuQ8kuc9pgc9s8qqaq=dirpe0xb9q8qiLsFr0=vr0=vr0dc8meaabaqaciaacaGaaeqabaqabeGadaaakeaaiiGacuWFbpGCgaqeaaaa@2E8B@, ρ¯ MathType@MTEF@5@5@+=feaafiart1ev1aaatCvAUfKttLearuWrP9MDH5MBPbIqV92AaeXatLxBI9gBaebbnrfifHhDYfgasaacH8akY=wiFfYdH8Gipec8Eeeu0xXdbba9frFj0=OqFfea0dXdd9vqai=hGuQ8kuc9pgc9s8qqaq=dirpe0xb9q8qiLsFr0=vr0=vr0dc8meaabaqaciaacaGaaeqabaqabeGadaaakeaaiiGacuWFbpGCgaqeaaaa@2E8B@C, and ρ¯ MathType@MTEF@5@5@+=feaafiart1ev1aaatCvAUfKttLearuWrP9MDH5MBPbIqV92AaeXatLxBI9gBaebbnrfifHhDYfgasaacH8akY=wiFfYdH8Gipec8Eeeu0xXdbba9frFj0=OqFfea0dXdd9vqai=hGuQ8kuc9pgc9s8qqaq=dirpe0xb9q8qiLsFr0=vr0=vr0dc8meaabaqaciaacaGaaeqabaqabeGadaaakeaaiiGacuWFbpGCgaqeaaaa@2E8B@S with N, quantitatively illustrating the behaviors described in (a), for the specific mutation rate μ = 0.04. Averages have been performed over 4000 generations and 25 realizations.
Figure 4
Figure 4
Relevant densities for different target structures. Dependence of ρ¯ MathType@MTEF@5@5@+=feaafiart1ev1aaatCvAUfKttLearuWrP9MDH5MBPbIqV92AaeXatLxBI9gBaebbnrfifHhDYfgasaacH8akY=wiFfYdH8Gipec8Eeeu0xXdbba9frFj0=OqFfea0dXdd9vqai=hGuQ8kuc9pgc9s8qqaq=dirpe0xb9q8qiLsFr0=vr0=vr0dc8meaabaqaciaacaGaaeqabaqabeGadaaakeaaiiGacuWFbpGCgaqeaaaa@2E8B@ (black lines) and ρ¯ MathType@MTEF@5@5@+=feaafiart1ev1aaatCvAUfKttLearuWrP9MDH5MBPbIqV92AaeXatLxBI9gBaebbnrfifHhDYfgasaacH8akY=wiFfYdH8Gipec8Eeeu0xXdbba9frFj0=OqFfea0dXdd9vqai=hGuQ8kuc9pgc9s8qqaq=dirpe0xb9q8qiLsFr0=vr0=vr0dc8meaabaqaciaacaGaaeqabaqabeGadaaakeaaiiGacuWFbpGCgaqeaaaa@2E8B@S (green lines) on the mutation rate μ and the length n of the target structure. The curves correspond to the hairpin structure (solid line), hammerhead structure (dotted line), 3-stem-loop structure (dashed line), model tRNA structure (dotted-dashed line), whose structures are specified in Table 1. The curves for ρ¯ MathType@MTEF@5@5@+=feaafiart1ev1aaatCvAUfKttLearuWrP9MDH5MBPbIqV92AaeXatLxBI9gBaebbnrfifHhDYfgasaacH8akY=wiFfYdH8Gipec8Eeeu0xXdbba9frFj0=OqFfea0dXdd9vqai=hGuQ8kuc9pgc9s8qqaq=dirpe0xb9q8qiLsFr0=vr0=vr0dc8meaabaqaciaacaGaaeqabaqabeGadaaakeaaiiGacuWFbpGCgaqeaaaa@2E8B@ almost coincide when the dependent variable is scaled as μn. Population size is N = 602; averages over 4000 generations and 25 realizations have been performed.
Figure 5
Figure 5
Search and fixation time (in number of generations) as a function of μ. (a) Curves corresponding to average values of the search time gA when the target structure shows up for the first time in the population (dotted curve) and the total time gF of search plus fixation (solid curve). Most of the transient corresponds to searching time except for values of μ close to the threshold, where the limiting step is fixation. (b) Fixation time for μ = 0.002. After appearance (gA), it takes few generations to attain stationary values (ρ¯ MathType@MTEF@5@5@+=feaafiart1ev1aaatCvAUfKttLearuWrP9MDH5MBPbIqV92AaeXatLxBI9gBaebbnrfifHhDYfgasaacH8akY=wiFfYdH8Gipec8Eeeu0xXdbba9frFj0=OqFfea0dXdd9vqai=hGuQ8kuc9pgc9s8qqaq=dirpe0xb9q8qiLsFr0=vr0=vr0dc8meaabaqaciaacaGaaeqabaqabeGadaaakeaaiiGacuWFbpGCgaqeaaaa@2E8B@ = 0.965 ± 0.008). (c) Fixation time for μ = 0.05 (ρ¯ MathType@MTEF@5@5@+=feaafiart1ev1aaatCvAUfKttLearuWrP9MDH5MBPbIqV92AaeXatLxBI9gBaebbnrfifHhDYfgasaacH8akY=wiFfYdH8Gipec8Eeeu0xXdbba9frFj0=OqFfea0dXdd9vqai=hGuQ8kuc9pgc9s8qqaq=dirpe0xb9q8qiLsFr0=vr0=vr0dc8meaabaqaciaacaGaaeqabaqabeGadaaakeaaiiGacuWFbpGCgaqeaaaa@2E8B@ = 0.039 ± 0.020, shown as dashed and dotted horizontal lines). The probability to lose the target structure after its first appearance is high, fixation becomes difficult and, even if the asymptotic regime is reached on average, population fluctuations can lead to the occasional disappearance of the target structure. This is quantified by the very large fluctuations displayed by ρ, here shown as error bars. Simulations have been made for the hairpin structure, N = 602, and averages of 200 (a) and 25 (b, c) realizations have been performed.
Figure 6
Figure 6
Search and fixation time as a function of μ for different target structures. The number of generations required to find and fix the target structure depends not only on the length of the sequence, but also on its specific secondary structure. It takes longer to fix a hammerhead structure than a hairpin structure of the same length. The interval of μ values where the structure can be effectively fixed shrinks as n increases. Simulations have been made for the hairpin structure (solid line), hammerhead structure (dotted line), 3-stem-loop structure (dashed line), model tRNA structure (dotted-dashed line), N = 602, and averages of 200 realizations have been performed.
Figure 7
Figure 7
Structural stability: disintegration of collective information depends on the secondary structure, example hairpin. We represent, for each position along the sequences in the population, the total number of secondary structures presenting each structural state. In this case, we have only considered those sequences that do not fold into the hairpin structure. Subplots correspond to increasing values of the mutation rate μ = 0.04 (a), μ = 0.05 (b), μ = 0.06 (c), and μ = 0.07 (d). This representation permits to identify robust motifs in the secondary structure, that is, structural parts that are maintained at high values of μ. Curves have been calculated from the asymptotic state (after 6000 generations) of 25 simulations for a population with N = 602. From the obtained 15050 structures, those folding into the target structure have been discounted: 1891 (a), 590 (b), 70 (c), 0 (d). Black dots denote unpaired positions ".", red triangles directed to the right correspond to upstream pairs "(", and green triangles directed to the left are downstream paired ")" nucleotides. The consensus structure is obtained by taking the most frequent state at each position.
Figure 8
Figure 8
Structural stability: disintegration of collective information depends on the secondary structure, example hammerhead. The same as for Fig. 7, but for the hammerhead structure and mutation rates μ = 0.04 (a), μ = 0.05 (b), μ = 0.06 (c), and μ = 0.07 (d). Correctly folding sequences have been discounted: 1987 (a), 484 (b) and 0 (c, d).

Similar articles

Cited by

References

    1. Eigen M. Self-organization of matter and the the evolution of biological macromolecules. Naturwissenschaften. 1971;58:465–523. doi: 10.1007/BF00623322. - DOI - PubMed
    1. Eigen M, Schuster P. The hypercycle A principle of natural self-organization. Springer-Verlag, Heidelberg; 1979. - PubMed
    1. Huynen MA, Stadler PF, Fontana W. Smoothness within ruggedness: the role of neutrality in adaptation. Proc Natl Acad Sci USA. 1996;93:397–401. doi: 10.1073/pnas.93.1.397. - DOI - PMC - PubMed
    1. Ancel LW, Fontana W. Plasticity, evolvability, and modularity in RNA. J Exp Zool. 2000;288:242–283. doi: 10.1002/1097-010X(20001015)288:3<242::AID-JEZ5>3.0.CO;2-O. - DOI - PubMed
    1. Fontana W. Modelling 'evo-devo' with RNA. BioEssays. 2002;24:1164–1177. doi: 10.1002/bies.10190. - DOI - PubMed

Publication types

LinkOut - more resources