

Quantitative assessment of relationship between sequence similarity and function similarity
- PMID: 17620139
- PMCID: PMC1949826
- DOI: 10.1186/1471-2164-8-222
Quantitative assessment of relationship between sequence similarity and function similarity
Abstract
Background: Comparative sequence analysis is considered as the first step towards annotating new proteins in genome annotation. However, sequence comparison may lead to creation and propagation of function assignment errors. Thus, it is important to perform a thorough analysis for the quality of sequence-based function assignment using large-scale data in a systematic way.
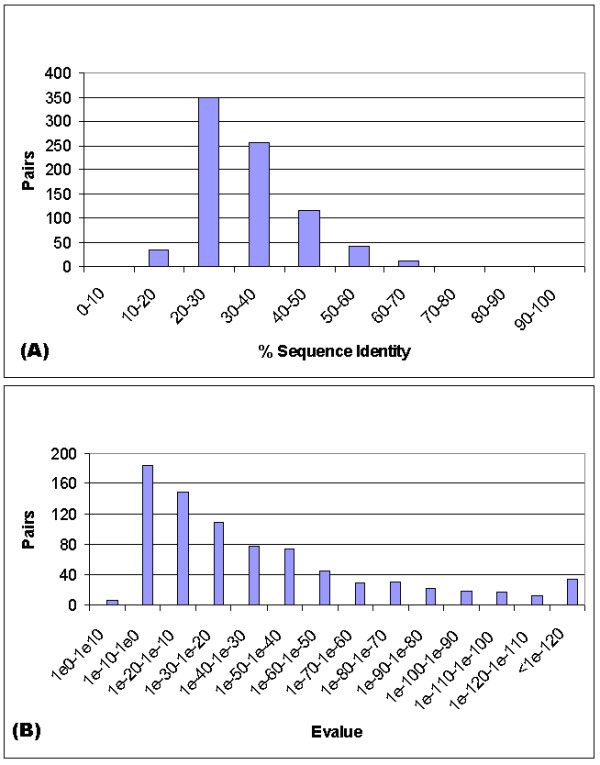
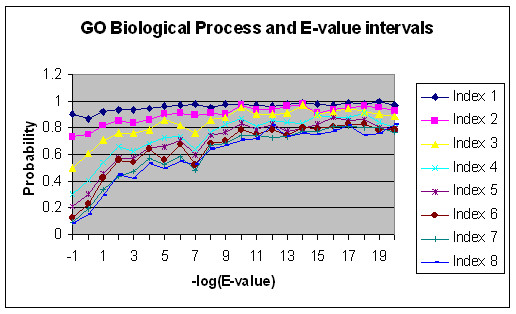
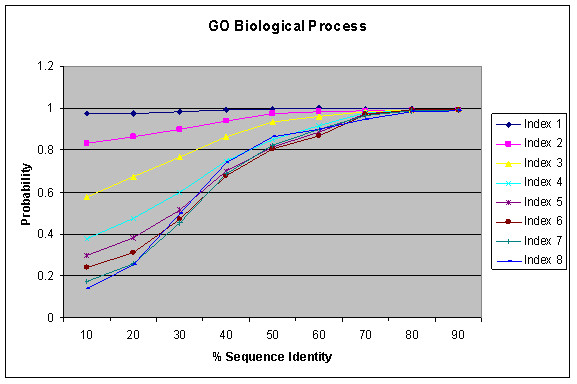
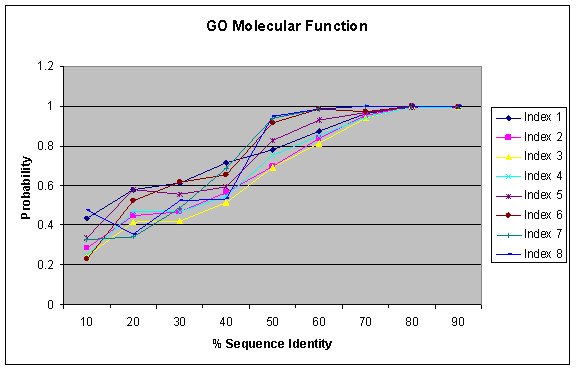
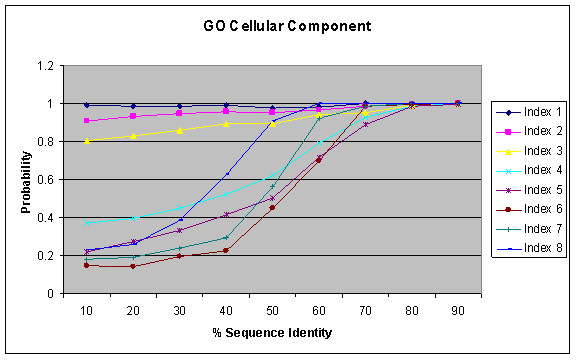
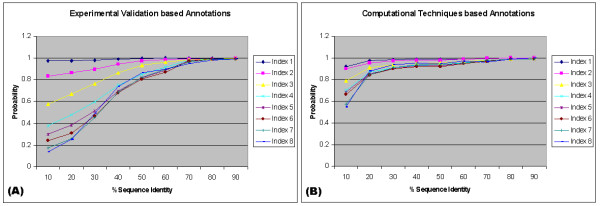
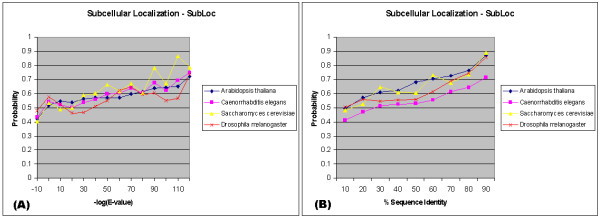
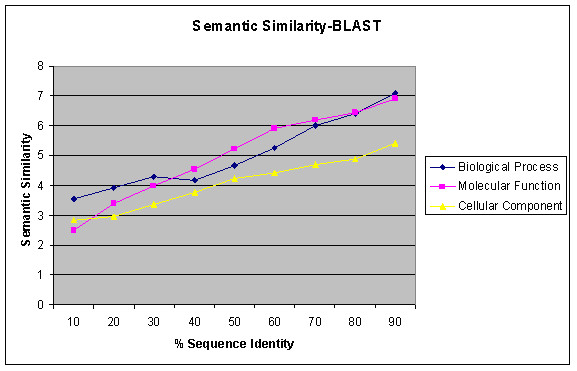
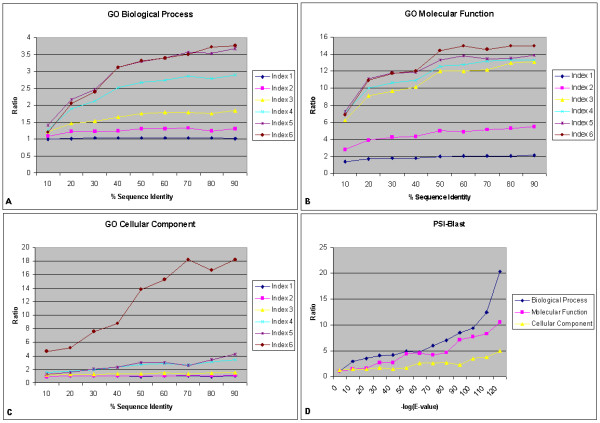
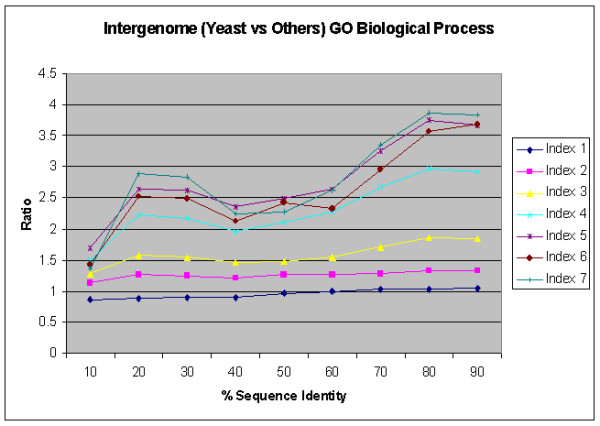
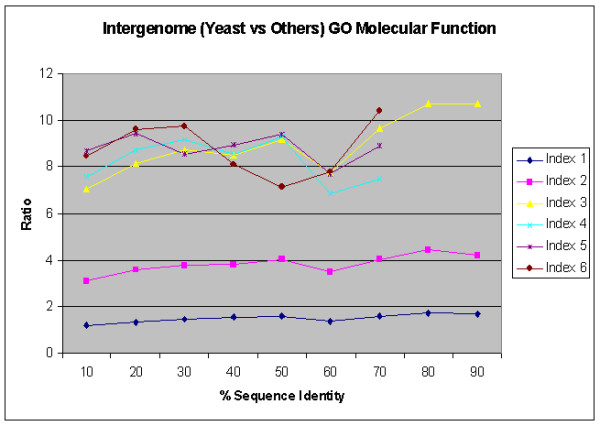
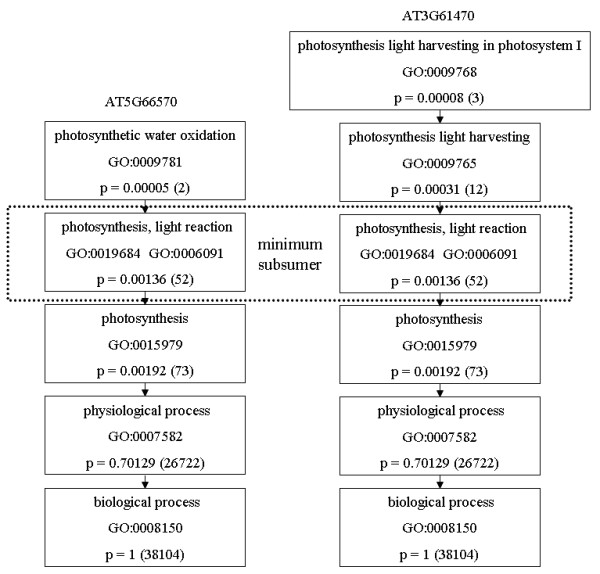
Results: We present an analysis of the relationship between sequence similarity and function similarity for the proteins in four model organisms, i.e., Arabidopsis thaliana, Saccharomyces cerevisiae, Caenorrhabditis elegans, and Drosophila melanogaster. Using a measure of functional similarity based on the three categories of Gene Ontology (GO) classifications (biological process, molecular function, and cellular component), we quantified the correlation between functional similarity and sequence similarity measured by sequence identity or statistical significance of the alignment and compared such a correlation against randomly chosen protein pairs.
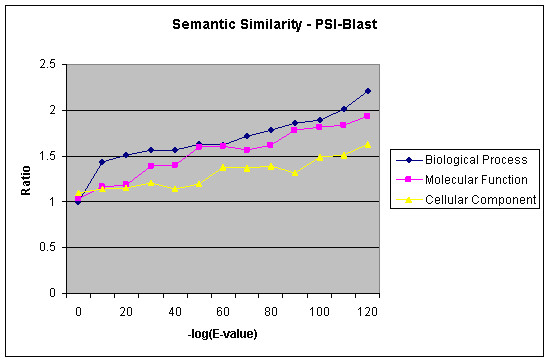
Conclusion: Various sequence-function relationships were identified from BLAST versus PSI-BLAST, sequence identity versus Expectation Value, GO indices versus semantic similarity approaches, and within genome versus between genome comparisons, for the three GO categories. Our study provides a benchmark to estimate the confidence in assignment of functions purely based on sequence similarity.
Figures
Similar articles
-
Assessing annotation transfer for genomics: quantifying the relations between protein sequence, structure and function through traditional and probabilistic scores.J Mol Biol. 2000 Mar 17;297(1):233-49. doi: 10.1006/jmbi.2000.3550. J Mol Biol. 2000. PMID: 10704319
-
GOtcha: a new method for prediction of protein function assessed by the annotation of seven genomes.BMC Bioinformatics. 2004 Nov 18;5:178. doi: 10.1186/1471-2105-5-178. BMC Bioinformatics. 2004. PMID: 15550167 Free PMC article.
-
AVID: an integrative framework for discovering functional relationships among proteins.BMC Bioinformatics. 2005 Jun 1;6:136. doi: 10.1186/1471-2105-6-136. BMC Bioinformatics. 2005. PMID: 15929793 Free PMC article.
-
Predicting functions from protein sequences--where are the bottlenecks?Nat Genet. 1998 Apr;18(4):313-8. doi: 10.1038/ng0498-313. Nat Genet. 1998. PMID: 9537411 Review.
-
Can bioinformatics help in the identification of moonlighting proteins?Biochem Soc Trans. 2014 Dec;42(6):1692-7. doi: 10.1042/BST20140241. Biochem Soc Trans. 2014. PMID: 25399591 Review.
Cited by
-
The New Coronavirus (SARS-CoV-2): A Comprehensive Review on Immunity and the Application of Bioinformatics and Molecular Modeling to the Discovery of Potential Anti-SARS-CoV-2 Agents.Molecules. 2020 Sep 7;25(18):4086. doi: 10.3390/molecules25184086. Molecules. 2020. PMID: 32906733 Free PMC article. Review.
-
ISM1 protects lung homeostasis via cell-surface GRP78-mediated alveolar macrophage apoptosis.Proc Natl Acad Sci U S A. 2022 Jan 25;119(4):e2019161119. doi: 10.1073/pnas.2019161119. Proc Natl Acad Sci U S A. 2022. PMID: 35046017 Free PMC article.
-
Tissue-specific genes as an underutilized resource in drug discovery.Sci Rep. 2019 May 10;9(1):7233. doi: 10.1038/s41598-019-43829-9. Sci Rep. 2019. PMID: 31076736 Free PMC article.
-
A genome-wide structure-based survey of nucleotide binding proteins in M. tuberculosis.Sci Rep. 2017 Oct 2;7(1):12489. doi: 10.1038/s41598-017-12471-8. Sci Rep. 2017. PMID: 28970579 Free PMC article.
-
Protein complex discovery by interaction filtering from protein interaction networks using mutual rank coexpression and sequence similarity.Biomed Res Int. 2015;2015:165186. doi: 10.1155/2015/165186. Epub 2015 Jan 27. Biomed Res Int. 2015. PMID: 25692131 Free PMC article.
References
-
- Schneider R, Casari G, Antoine DD, Bremer P, Schlenkrich M, et al. Supercomputer 1996: Anwendungen, Architekturen, Trends. 1997. GeneCrunch: Experiences on the SGI POWER CHALLENGE array with bioinformatics applications; pp. 109–119.
Publication types
MeSH terms
Substances
LinkOut - more resources
Full Text Sources
Other Literature Sources
Molecular Biology Databases
Research Materials
