

Role of outer surface protein D in the Borrelia burgdorferi life cycle
- PMID: 17620358
- PMCID: PMC1951184
- DOI: 10.1128/IAI.00632-07
Role of outer surface protein D in the Borrelia burgdorferi life cycle
Abstract
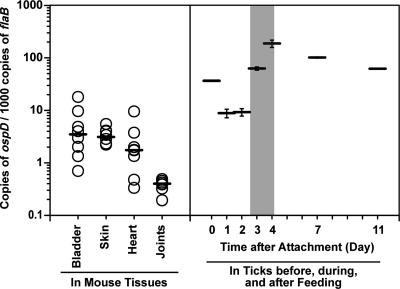
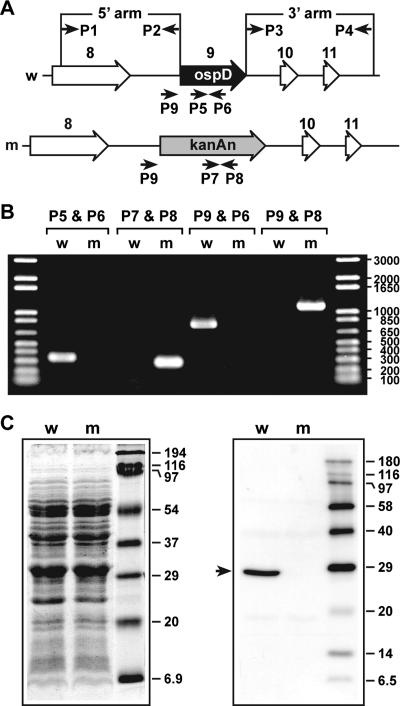
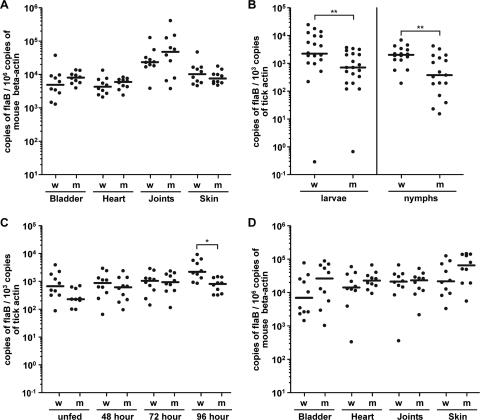
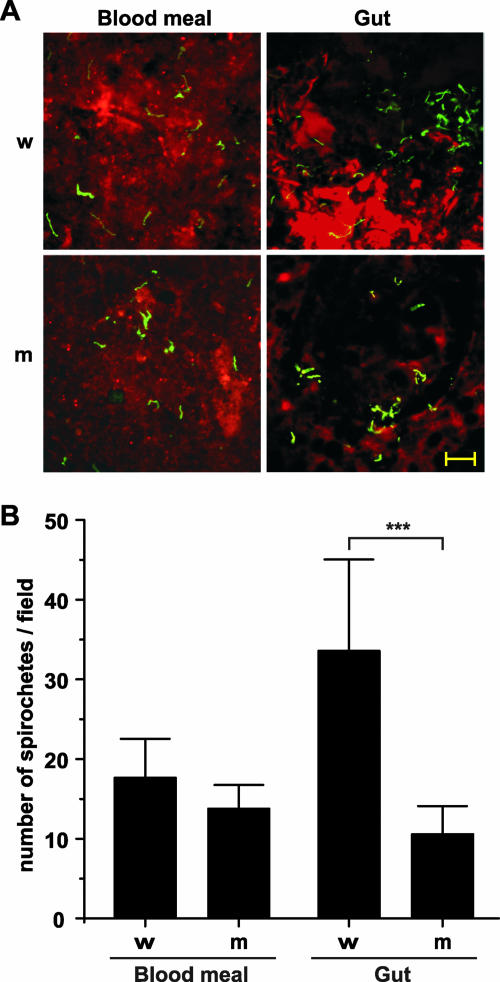
Borrelia burgdorferi preferentially induces selected genes in mice or ticks, and studies suggest that ospD is down-regulated in response to host-specific signals. We now directly show that ospD expression is generally elevated within Ixodes scapularis compared with mice. We then assessed the importance of OspD throughout the spirochete life cycle by generating OspD-deficient B. burgdorferi and examining the mutant in the murine model of tick-transmitted Lyme borreliosis. The lack of OspD did not influence B. burgdorferi infectivity in mice or the acquisition of spirochetes by I. scapularis. OspD adhered to tick gut extracts in vitro, and the OspD-deficient B. burgdorferi strain had a threefold decrease in colonization of the tick gut in vivo. This decrease, however, did not alter subsequent spirochete transmission during a second blood meal. These data suggest that B. burgdorferi can compensate for the lack of OspD in both ticks and mice and that OspD may have a nonessential, secondary, role in B. burgdorferi persistence within I. scapularis.
Figures
Similar articles
-
A tightly regulated surface protein of Borrelia burgdorferi is not essential to the mouse-tick infectious cycle.Infect Immun. 2008 May;76(5):1970-8. doi: 10.1128/IAI.00714-07. Epub 2008 Mar 10. Infect Immun. 2008. PMID: 18332210 Free PMC article.
-
Outer surface protein B is critical for Borrelia burgdorferi adherence and survival within Ixodes ticks.PLoS Pathog. 2007 Mar;3(3):e33. doi: 10.1371/journal.ppat.0030033. PLoS Pathog. 2007. PMID: 17352535 Free PMC article.
-
OspC facilitates Borrelia burgdorferi invasion of Ixodes scapularis salivary glands.J Clin Invest. 2004 Jan;113(2):220-30. doi: 10.1172/JCI19894. J Clin Invest. 2004. PMID: 14722614 Free PMC article.
-
Tick-host-pathogen interactions in Lyme borreliosis.Trends Parasitol. 2007 Sep;23(9):434-8. doi: 10.1016/j.pt.2007.07.001. Epub 2007 Jul 25. Trends Parasitol. 2007. PMID: 17656156 Review.
-
Physiologic and Genetic Factors Influencing the Zoonotic Cycle of Borrelia burgdorferi.Curr Top Microbiol Immunol. 2018;415:63-82. doi: 10.1007/82_2017_43. Curr Top Microbiol Immunol. 2018. PMID: 28864829 Review.
Cited by
-
Passage through Ixodes scapularis ticks enhances the virulence of a weakly pathogenic isolate of Borrelia burgdorferi.Infect Immun. 2010 Jan;78(1):138-44. doi: 10.1128/IAI.00470-09. Epub 2009 Oct 12. Infect Immun. 2010. PMID: 19822652 Free PMC article.
-
VlsE, the nexus for antigenic variation of the Lyme disease spirochete, also mediates early bacterial attachment to the host microvasculature under shear force.PLoS Pathog. 2022 May 23;18(5):e1010511. doi: 10.1371/journal.ppat.1010511. eCollection 2022 May. PLoS Pathog. 2022. PMID: 35605029 Free PMC article.
-
Tick-specific borrelial antigens appear to be upregulated in American but not European patients with Lyme arthritis, a late manifestation of Lyme borreliosis.J Infect Dis. 2013 Sep;208(6):934-41. doi: 10.1093/infdis/jit269. Epub 2013 Jun 12. J Infect Dis. 2013. PMID: 23766526 Free PMC article.
-
Molecular characterization of the tick-Borrelia interface.Front Biosci (Landmark Ed). 2009 Jan 1;14(8):3051-63. doi: 10.2741/3434. Front Biosci (Landmark Ed). 2009. PMID: 19273256 Free PMC article. Review.
-
BB0323 function is essential for Borrelia burgdorferi virulence and persistence through tick-rodent transmission cycle.J Infect Dis. 2009 Oct 15;200(8):1318-30. doi: 10.1086/605846. J Infect Dis. 2009. PMID: 19754308 Free PMC article.
References
-
- Barthold, S. W., D. S. Beck, G. M. Hansen, G. A. Terwilliger, and K. D. Moody. 1990. Lyme borreliosis in selected strains and ages of laboratory mice. J. Infect. Dis. 162:133-138. - PubMed
-
- Burgdorfer, W., A. G. Barbour, S. F. Hayes, J. L. Benach, E. Grunwaldt, and J. P. Davis. 1982. Lyme disease—a tick-borne spirochetosis? Science 216:1317-1319. - PubMed
-
- Casjens, S., N. Palmer, R. van Vugt, W. M. Huang, B. Stevenson, P. Rosa, R. Lathigra, G. Sutton, J. Peterson, R. J. Dodson, D. Haft, E. Hickey, M. Gwinn, O. White, and C. M. Fraser. 2000. A bacterial genome in flux: the twelve linear and nine circular extrachromosomal DNAs in an infectious isolate of the Lyme disease spirochete Borrelia burgdorferi. Mol. Microbiol. 35:490-516. - PubMed
Publication types
MeSH terms
Substances
LinkOut - more resources
Full Text Sources
Medical
