. 2007 Aug 6;204(8):1775-85.
doi: 10.1084/jem.20070602. Epub 2007 Jul 9.

Small intestine lamina propria dendritic cells promote de novo generation of Foxp3 T reg cells via retinoic acid

Affiliations

Small intestine lamina propria dendritic cells promote de novo generation of Foxp3 T reg cells via retinoic acid

Cheng-Ming Sun et al. J Exp Med. .

Abstract

To maintain immune homeostasis, the intestinal immune system has evolved redundant regulatory strategies. In this regard, the gut is home to a large number of regulatory T (T reg) cells, including the Foxp3(+) T reg cell. Therefore, we hypothesized that the gut environment preferentially supports extrathymic T reg cell development. We show that peripheral conversion of CD4(+) T cells to T reg cells occurs primarily in gut-associated lymphoid tissue (GALT) after oral exposure to antigen and in a lymphopenic environment. Dendritic cells (DCs) purified from the lamina propria (Lp; LpDCs) of the small intestine were found to promote a high level of T reg cell conversion relative to lymphoid organ-derived DCs. This enhanced conversion by LpDCs was dependent on TGF-beta and retinoic acid (RA), which is a vitamin A metabolite highly expressed in GALT. Together, these data demonstrate that the intestinal immune system has evolved a self-contained strategy to promote T reg cell neoconversion.


Figures
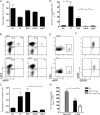
Figure 1.
Figure 1.
Conversion or accumulation of converted Foxp3+ CD4+ T cells occurs primarily in the GALT. 4–17 wk after transfer of Ly5.1+CD4+CD25hi T reg cells and Ly5.2+CD4+eGFP T cells into RAG-1−/− hosts, T reg cell conversion was assessed in various tissues by surface staining and flow cytometric analysis. (A) Homeostatic proliferation of Ly5.1+ T reg cell cells and Ly5.2+ cells was similar in all tissues examined. (B–D) Conversion of Ly5.2+eGFP cells into eGFP+ T reg cells occurred mainly in the MLN and LP, in both percentage (C) and total number (D) of cells. Data in A–D are from the 8-wk time point. The experiment was repeated at least four times with similar results. (E and F) CD25 and CD103 expression on converted eGFP+ T cells in the MLN and LP. Cells gated on Ly5.2 and CD4 that express eGFP (E) also express CD25 and CD103 (F). Data in E and F are from the 17-wk time point and the experiment was repeated at least three times. (G) Converted eGFP+ T reg cells are able to suppress Teff proliferation. Converted Ly5.2+eGFP+ T reg cells were isolated from host peripheral LN and cultured in vitro with freshly isolated splenic DCs and peripheral LN CD4+eGFP Teff cells stimulated with α-CD3. Freshly isolated peripheral LN CD4+eGFP+ T reg cells were used as controls. Suppressive function was assessed at a ratio of 1 T reg cell: 5 Teff. The representative experiment shown was performed twice, with identical results. Results of student's t test: *, P < 0.05; **, P < 0.001. Error bars represent the SD.
Figure 2.
Figure 2.
Foxp3 expression by RAG1−/− OT-II T cells in the GALT after oral administration of OVA protein. Ly5.2+ RAG1−/− OT-II T cells were transferred into Ly5.1+ recipient mice. Recipient mice were fed OVA antigen in drinking water for 5 d. On day 6, T reg cell conversion was assessed in various tissues by intracellular staining for Foxp3 and detected via flow cytometry. (A) After gating on CD4+ T cells, transferred T cells in OVA antigen-fed mice were identified by Ly5.2 expression. Ly5.2+ cells were then assessed for intracellular Foxp3 expression. Detection of Foxp3+ cells is illustrated for spleen (Sp), PP, and small intestinal Lp (bottom row). (B) Summary of the percentage of Ly5.2+ RAG1−/− OT-II T cells expressing Foxp3. Each dot represents a single mouse. Data were combined from two individual experiments (three mice each). (C) Absolute number of Ly5.2+Foxp3+ cells in OVA antigen-fed mice (▴) and nonfed control (▪). Error bars represent the SDs of the means of six individual samples from two combined experiments. Statistical comparisons were performed using the Student's t test, with Sp tissue serving as the baseline comparison for each tissue. *, P < 0.05; **, P < 0.01; ***, P < 0.001.
Figure 3.
Figure 3.
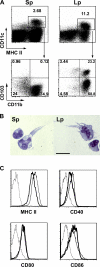
Phenotype of SpDCs and LpDCs. (A) Total spleen cells and Lp cells were stained with α-MHCII, α−CD11c, α−CD103 and α-CD11b mAb. (top) The percentages of CD11c+MHCII+ cells. (bottom) CD103 versus CD11b expression on CD11c+MHC II+ gated events. Numbers represent the percentage of events in each quadrant. (B) Giemsa staining of sorted spleen (left) and Lp (right) CD11c+MHCII+ DCs. Bar, 15 μm. (C) Expression of MHC II, CD40, CD80, and CD86 of spleen DC (thick line) and LpDC (thin line) were analyzed on CD11c+MHCII+ cells. Dotted line represents the corresponding isotype control. Data are from one of at least three independent experiments.
Figure 4.
Figure 4.
Intestinal DCs induce Foxp3 expression of effector T cells with higher efficiency than splenic DC. (A) 105 Foxp3 cells were cultured with 2 × 10⁴ splenic or LpDCs for 5 d with α-CD3 mAb alone or combined with TGF-β. Plots are gated on CD4+ cells, and the percentages of Foxp3+ cells are shown. Phenotypic analysis of converted T reg cells is shown on the right. 5-d cultured cells from A were stained for CD4 and CD103. Histogram shows the CD103 expression of CD4+Foxp3+ cells cultured with SpDCs (thick line) or LpDCs (thin line). (B) 105 Foxp3CD4+ T cells cultured with DCs and α-CD3 mAb and TGF-β as in (A) for 5 d, with the ratio of T/DC as 5/1, 10/1, 20/1 or 40/1. Data are the mean ± SD of triplicate wells. (C) Foxp3 cells were cultured as in A with CD103+LpDC or CD103LpDC. Plots are gated on CD4+ cells and Foxp3 versus α4β7 stainings are shown. The numbers indicate percentage of events in each quadrant. Data are from one of at least three independent experiments.
Figure 5.
Figure 5.
Maintenance of Foxp3 contributes to higher frequency of Foxp3+CD4+ T cells in the presence of LpDC. (A) eGFPCD4+ T cells were cocultured with purified DC at a 5:1 ratio with α-CD3 and TGF-β. At indicated time points, cells were harvested and stained for CD4, Class II, and 7-AAD. Foxp3 expression was determined based on eGFP fluorescence. The percentage of viable cells is depicted by open bars for LpDC and filled bars for SpDC. Data are from one of two independent experiments. (B) CFSE-labeled naive CD4+ T cells were cocultured with purified DCs as described in A. On day 5, cells were harvested and stained for CD4 and intracellular Foxp3. Illustrated are dot plots of Foxp3 versus CFSE. The percentage of Foxp3+ cells and the MFI was defined as the bordered population. (C) In cultures containing LpDC (○) or SpDC (•) the proportion of Foxp3+ cells among CD4 T cells is plotted as a function of the number of cell divisions. Data are representative of three independent experiments.
Figure 6.
Figure 6.
RA production by LpDC is requisite for optimal Foxp3+ T reg cell conversion. Foxp3 CD4 T cells were cocultured with DC at a 10:1 ratio as described in Fig 4. (A) Cells were stained for α4β7 and assessed for eGFP fluorescence (Foxp3) by flow cytometry. Results are representative of three independent experiments. (B) The dose responsiveness of all-trans RA on eGFP (Foxp3) expression by CD4 T cells cocultured with SpDC was determined by flow cytometry. Error bars represent the SDs of the means of three individual samples from one experiment. Statistical significance was determined using the Student's t test. *, P < 0.05; **, P < 0.01; ***, P < 0.001. Results are representative of three independent experiments. (C) Foxp3 CD4+ T cells were cocultured with CD103+ or CD103 DC at a 10:1 ratio as described in Fig 4. Cells were stained for α4β7 and the effect of 100 nM RA, or the RA receptor inhibitors LE540 and LE135 on (eGFP) Foxp3 expression was determined by flow cytometry. Results are representative of three independent experiments. (D) Foxp3 CD4 T cells were cocultured with CD103+ DC in the presence of α-CD3 or α-CD3 in combination with TGF-β neutralizing antibody (isotype IgG1) or LE540 and LE135. eGFP (Foxp3) expression was determined by flow cytometry. NS. Error bars represent the SD from the means of three independent experiments. ***, P < 0.001.

Comment in

Similar articles

Cited by

References

    1. Fontenot, J.D., J.L. Dooley, A.G. Farr, and A.Y. Rudensky. 2005. Developmental regulation of Foxp3 expression during ontogeny. J. Exp. Med. 202:901–906. - PMC - PubMed
    1. Bensinger, S.J., A. Bandeira, M.S. Jordan, A.J. Caton, and T.M. Laufer. 2001. Major histocompatibility complex class II–positive cortical epithelium mediates the selection of CD4+25+ immunoregulatory T cells. J. Exp. Med. 194:427–438. - PMC - PubMed
    1. Jordan, M.S., A. Boesteanu, A.J. Reed, A.L. Petrone, A.E. Holenbeck, M.A. Lerman, A. Naji, and A.J. Caton. 2001. Thymic selection of CD4+CD25+ regulatory T cells induced by an agonist self-peptide. Nat. Immunol. 2:301–306. - PubMed
    1. Chen, W., W. Jin, N. Hardegen, K.J. Lei, L. Li, N. Marinos, G. McGrady, and S.M. Wahl. 2003. Conversion of peripheral CD4+CD25− naive T cells to CD4+CD25+ regulatory T cells by TGF-β induction of transcription factor Foxp3. J. Exp. Med. 198:1875–1886. - PMC - PubMed
    1. Bettelli, E., Y. Carrier, W. Gao, T. Korn, T.B. Strom, M. Oukka, H.L. Weiner, and V.K. Kuchroo. 2006. Reciprocal developmental pathways for the generation of pathogenic effector TH17 and regulatory T cells. Nature. 441:235–238. - PubMed

Publication types