. 2007 Aug 6;204(8):1765-74.
doi: 10.1084/jem.20070719. Epub 2007 Jul 9.

All-trans retinoic acid mediates enhanced T reg cell growth, differentiation, and gut homing in the face of high levels of co-stimulation

Affiliations

All-trans retinoic acid mediates enhanced T reg cell growth, differentiation, and gut homing in the face of high levels of co-stimulation

Micah J Benson et al. J Exp Med. .

Abstract

We demonstrate that all-trans retinoic acid (RA) induces FoxP3(+) adaptive T regulatory cells (A-Tregs) to acquire a gut-homing phenotype (alpha 4 beta 7(+) CC chemokine receptor 9(+)) and the capacity to home to the lamina propria of the small intestine. Under conditions that favor the differentiation of A-Tregs (transforming growth factor-beta1 and interleukin 2) in vitro, the inclusion of RA induces nearly all activated CD4(+) T cells to express FoxP3 and greatly increases the accumulation of these cells. In the absence of RA, A-Treg differentiation is abruptly impaired by proficient antigen presenting cells or through direct co-stimulation. In the presence of RA, A-Treg generation occurs even in the presence of high levels of co-stimulation, with RA attenuating co-stimulation from interfering from FoxP3 induction. The recognition that RA induces gut imprinting, together with our finding that it enhances A-Treg conversion, differentiation, and expansion, indicates that RA production in vivo may drive both the imprinting and A-Treg development in the face of overt inflammation.


Figures
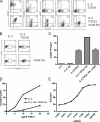
Figure 1.
Figure 1.
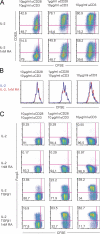
RA synergizes with TGF-β1 in the generation of gut-homing A-Tregs in vitro. (A and B) FACS-sorted CD4+Foxp3 cells from the Foxp3/GFP reporter mouse were cultured under activating conditions with IL-2 and TGF-β1 ± 10 nM RA, and surface phenotype and Foxp3/GFP expression was analyzed by flow cytometry after 5 d of culture. (A) Representative staining showing the percentage of Foxp3/GFP expression against CD25, CD62L, α4β7, CCR9, and CD103. (B) Representative FACS plot depicting Foxp3/GFP expression by CD4+ T cells. (C) Quantification of one representative experiment showing the percentage of Foxp3/GFP+ cells among all CD4+ cells, with the selective RA receptor antagonist LE540 (1 μM) included as indicated. Mean ± SEM is shown. (D) Foxp3/GFP expression by CD4+ cells as a function of titrating concentrations of TGF-β1 ± RA. IL-2 concentrations were kept constant, ±RA, with TGF-β1 (20 ng/ml, 10 ng/ml, 5 ng/ml, 1 ng/ml, and 0) titrated. (E) TGF-β–mediated Foxp3/GFP expression as a result of titrating concentrations of RA. Keeping IL-2 and TGF-β1 constant, RA was titrated in serial dilutions (100 nM, 10 nM, 1 nM, 100 pM, 10 pM, 1 pM, and 0). All experiments shown are representative of at least n = 3 independent experiments.
Figure 2.
Figure 2.
RA–T reg cells are suppressive in vitro and home to the small intestine in vivo. To examine the suppressive capacity of A-Tregs, RA–T reg cells, and nTregs, Ly5.2+Foxp3/GFP+ A-Tregs and RA–T reg cells were generated in vitro and sorted to >99% purity, with Ly5.2+ nTregs freshly isolated ex vivo from a Ly5.2+Foxp3/GFP reporter mouse. These T reg cell subsets were cultured with CFSE-labeled Ly5.1+CD4+ T effector cells at the indicated ratios under activating conditions. Representative CFSE plots of the T effector cells are shown (A), with the percentage of dividing T effector cells quantified (B). (C and D) Representative in vivo competitive homing assay. Naive CD4+Foxp3 cells were sorted from an Ly5.2+Foxp3/GFP reporter mouse and activated for 5 d in the presence of TGF-β1, IL-2, and RA to generate RA–T reg cells expressing Foxp3/GFP. Naive CD4+CD25 cells were sorted from an Ly5.2+ mouse and cultured under the same conditions, minus the RA, to generate A-Tregs lacking the Foxp3/GFP allele. These two cell populations were mixed and injected into recipient mice. (C) Organs were harvested after 18 h and stained for donor Ly5.2+CD4+ T cells, and the ratio of GFP+/− cells within the donor population was analyzed, with a representative mouse shown. Numbers show the percentage of transfered cells that are FoxP3/GFP and FoxP3/GFP+. (D) The HI (ration of [GFP+]tissue/[GFP]tissue to [GFP+]input/[GFP]input) was calculated, with bar graphs showing mean ± SEM of one representative experiment using three recipient mice. Peripheral lymph node (pLN): HI = 0.96 (SEM = 0.13); spleen: HI = 0.96 (SEM = 0.08); blood: HI = 0.56 (SEM = 0.05); lung: HI = 0.39 (SEM = 0.02); mesenteric lymph node (mLN): HI = 1.86 (SEM = 0.1); Peyer's patches (PP): HI = 3.46 (SEM = 0.33); and lamina propria (LP): HI = 12.27 (SEM = 0.77). All experiments are representative of at least two independent experiments. *, P < 0.05; **, P < 0.01; and ***, P < 0.001 compared with HI = 1 (dotted line).
Figure 3.
Figure 3.
DC expression of CD80/86 co-stimulatory molecules prevents Foxp3 induction by T cells, with exogenous RA overcoming this inhibition and allowing T reg cell generation. Sorted CD4+OTII+Foxp3 T cells from the OTII+Foxp3/GFP reporter mouse (100,000 T cells/well) were cultured with either purified WT or CD80/86 knockout CD19+ B cells or CD11c+ DCs (100,000 APCs/well) pulsed with ISQ peptide, or under activating conditions. Media was supplemented with 100 U IL-2, ±20 ng/ml TGF-β1, ±1 nM RA, ±10 μg/ml αCD154 (unless otherwise indicated) for 5 d. (A) WT or CD80/86 knockout splenic B cells or DCs plus T cells were cultured under the depicted culture conditions, and the percentage of CD4+ T cells expressing Foxp3/GFP was measured. (B) Same experimental conditions as in A, except with absolute CD4+ T cells per well counted, with white bars representing CD4+Foxp3 cells and green bars representing CD4+Foxp3+ cells. (C) Freshly harvested B cells (quiescent B cells) or 48-h preactivated B cells with the indicated stimulus were co-cultured with T cells, and the percentage of CD4+ cells expressing Foxp3/GFP was measured after 5 d. (D) CD4+ T cells were activated using 10 μg/ml of plate-bound αCD3 and titrating concentrations of αCD28, with media supplemented with IL-2 and TGF-β1 ±10 nM RA as indicated; Foxp3/GFP expression was plotted as a function of plate-bound αCD28 concentration. Mean ± SEM is depicted in A, B, and D.
Figure 4.
Figure 4.
RA enhances Foxp3 expression without impeding T cell activation and proliferation. Purified CFSE-labeled CD4+CD25 T cells from a WT B6 mouse were cultured with IL-2, TGF-β1, and 1 nM RA, as indicated, under activating conditions for 4 d, after which CD62L and Foxp3 expression was measured. (A) CFSE dye dilution versus CD62L expression is shown, with T cells cultured with IL-2 or IL-2 plus 1 nM RA under different activating conditions. The percentage of T cells within each quadrant is depicted. (B) Histograms depicting CFSE dye dilution profiles of the data shown in A (IL-2, blue; IL-2 with 1 nM RA, red). (C) CFSE dye dilution versus Foxp3 expression is shown with the indicated activating and culture conditions, with the percentage of cells in each quadrant shown. Representative experiments of at least n = 3 mice are shown.
Figure 5.
Figure 5.
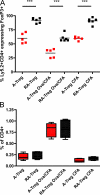
RA–T reg cells are refractory to reversion in vivo. The ability of RA–T reg cells and A-Tregs to revert in vivo was analyzed by transferring 1.5–2 × 10⁶ FACS-sorted congenically marked OTII+ RA–T reg cells or A-Tregs generated from a Ly5.2+OTII+Foxp3/GFP mice into Ly5.1+ hosts, who were either left untouched or intraperitoneally injected on the same day with either CFA or 1 mg OVA/CFA, as indicated. Donor RA–T reg cells or A-Tregs within the spleen were analyzed for Foxp3 expression on day 5 by staining for CD4+Ly5.2+ cells. RA–T reg cells are red, whereas A-Tregs are black (A). Horizontal lines represent the means. To examine relative donor T cell expansion 5 d after transfer, the percentage of donor OTII+ cells within the recipient splenic CD4+ compartment is shown in a box and whisker plot depicting the median, 25th, and 75th percentiles and range of values (B). Data are pooled from n = 3 independent experiments. ***, P < 0.001.

Comment in

Similar articles

Cited by

References

    1. Izcue, A., J.L. Coombes, and F. Powrie. 2006. Regulatory T cells suppress systemic and mucosal immune activation to control intestinal inflammation. Immunol. Rev. 212:256–271. - PubMed
    1. Bouma, G., and W. Strober. 2003. The immunological and genetic basis of inflammatory bowel disease. Nat. Rev. Immunol. 3:521–533. - PubMed
    1. Mora, J.R., M.R. Bono, N. Manjunath, W. Weninger, L.L. Cavanagh, M. Rosemblatt, and U.H. von Andrian. 2003. Selective imprinting of gut-homing T cells by Peyer's patch dendritic cells. Nature. 424:88–93. - PubMed
    1. Mora, J.R., G. Cheng, D. Picarella, M. Briskin, N. Buchanan, and U.H. von Andrian. 2005. Reciprocal and dynamic control of CD8 T cell homing by dendritic cells from skin- and gut-associated lymphoid tissues. J. Exp. Med. 201:303–316. - PMC - PubMed
    1. Berlin, C., E.L. Berg, M.J. Briskin, D.P. Andrew, P.J. Kilshaw, B. Holzmann, I.L. Weissman, A. Hamann, and E.C. Butcher. 1993. Alpha 4 beta 7 integrin mediates lymphocyte binding to the mucosal vascular addressin MAdCAM-1. Cell. 74:185–195. - PubMed

Publication types