. 2007 Jul 16;178(2):283-96.
doi: 10.1083/jcb.200702134. Epub 2007 Jul 9.

BUB1 mediation of caspase-independent mitotic death determines cell fate

Affiliations

BUB1 mediation of caspase-independent mitotic death determines cell fate

Yohei Niikura et al. J Cell Biol. .

Abstract

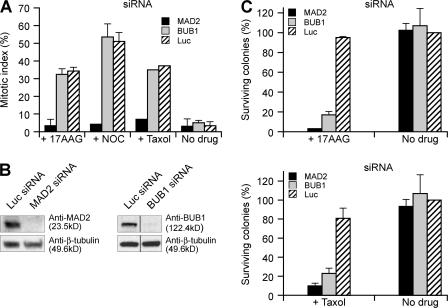
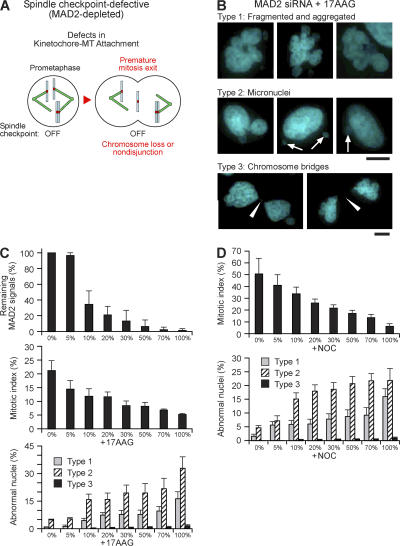
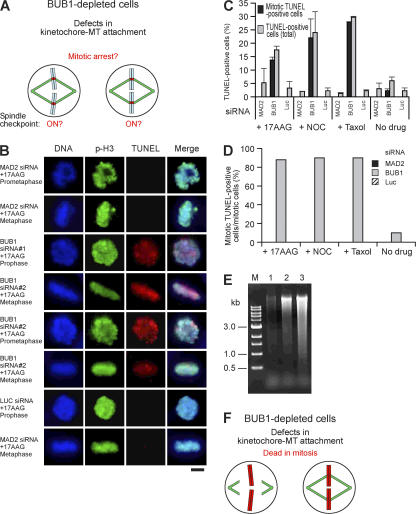
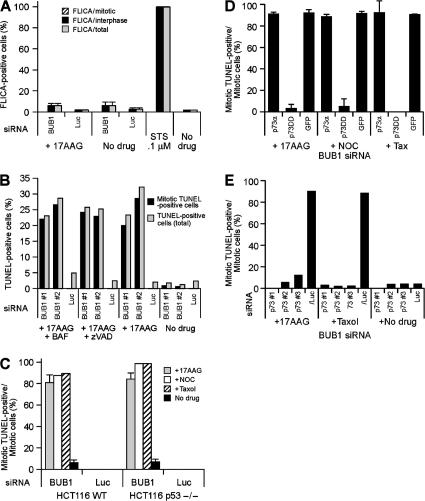
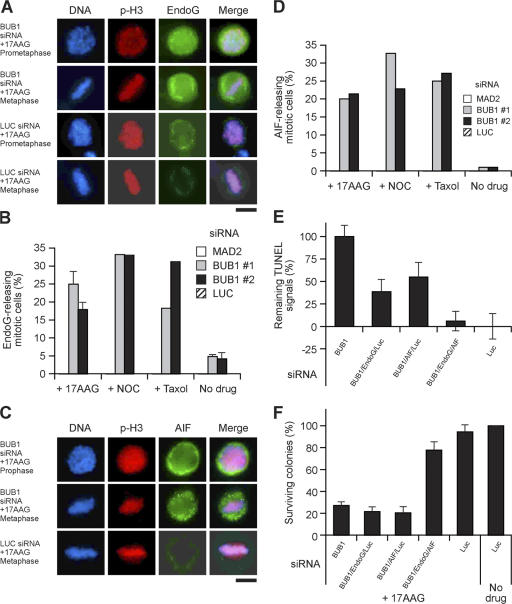
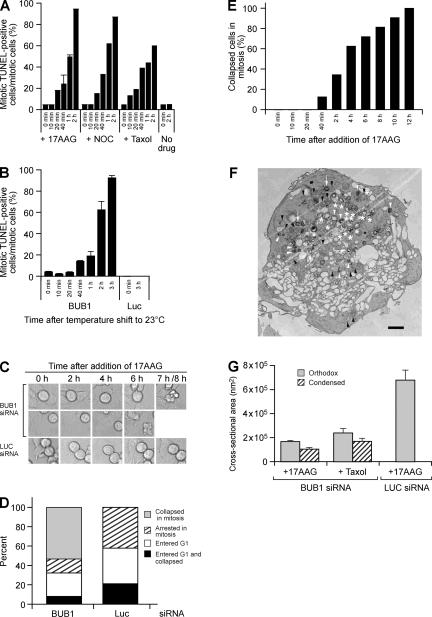
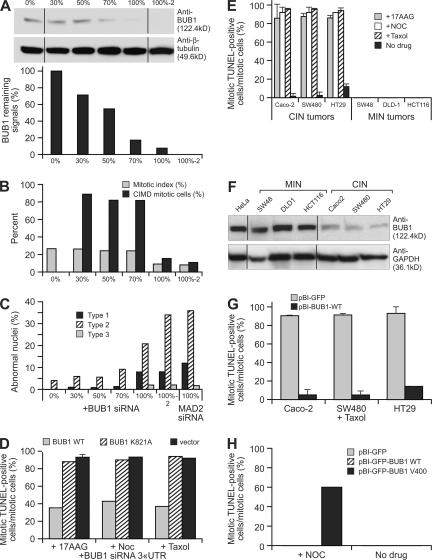
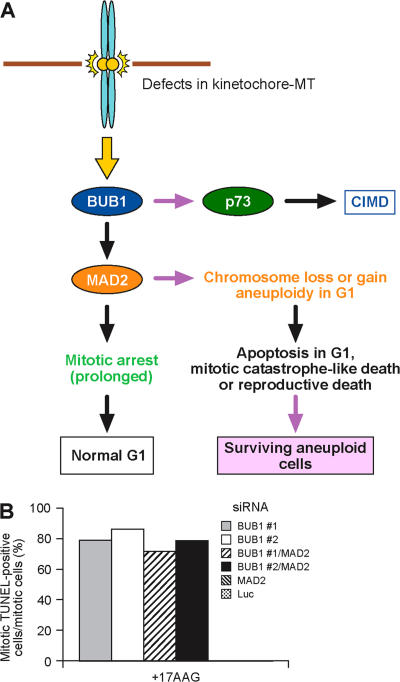
The spindle checkpoint that monitors kinetochore-microtubule attachment has been implicated in tumorigenesis; however, the relation between the spindle checkpoint and cell death remains obscure. In BUB1-deficient (but not MAD2-deficient) cells, conditions that activate the spindle checkpoint (i.e., cold shock or treatment with nocodazole, paclitaxel, or 17-AAG) induced DNA fragmentation during early mitosis. This mitotic cell death was independent of caspase activation; therefore, we named it caspase-independent mitotic death (CIMD). CIMD depends on p73, a homologue of p53, but not on p53. CIMD also depends on apoptosis-inducing factor and endonuclease G, which are effectors of caspase-independent cell death. Treatment with nocodazole, paclitaxel, or 17-AAG induced CIMD in cell lines derived from colon tumors with chromosome instability, but not in cells from colon tumors with microsatellite instability. This result was due to low BUB1 expression in the former cell lines. When BUB1 is completely depleted, aneuploidy rather than CIMD occurs. These results suggest that cells prone to substantial chromosome missegregation might be eliminated via CIMD.


Figures

Figure 1.
Figure 1.
Mitotic delay induced by defects in kinetochore-microtubule attachment was not affected by substantial depletion of BUB1. (A) The proportion of cells in mitotic arrest caused by 17-AAG (+17AAG), nocodazole (+NOC), or paclitaxel (+Taxol) was reduced by MAD2 siRNA, but not by BUB1 siRNA. We added 17-AAG (500 nM), NOC (0.5 μg/ml), or Taxol (10 nM) 48 h after transfection with MAD2 siRNA, BUB1 siRNA, or luciferase (Luc) siRNA, and the cells were incubated for 24 h. Cells were fixed, stained with DAPI, and subjected to fluorescence microscopy. The mean percentages (± SD) of cells in prophase, prometaphase, or metaphase are shown, as determined by analyzying 500 cells in three independent experiments. (B) Western blot analysis of total HeLa cell lysates harvested 48 h after transfection with siRNA duplexes directed against MAD2 (left) and BUB1 (right) revealed protein depletion. Luc siRNA was transfected into the cells as a control. The level of β-tubulin protein was used as a loading control. (C) Depletion of MAD2 or BUB1 sensitizes cells to 17-AAG (top) and Taxol (bottom). Colony outgrowth assays of HeLa cells transfected with siRNAs against MAD2, BUB1, or Luc. We normalized the percent viability; the percentage of surviving colonies in control wells (Luc siRNA and no drug) was set to 100. Three independent experiments were performed for each drug.
Figure 2.
Figure 2.
MAD2 depletion causes premature exit from mitosis. (A) A model showing how chromosome loss or nondisjunction occurs in spindle checkpoint–defective cells. In spindle checkpoint mutant cells, the spindle checkpoint is not activated, even if kinetochore–microtubule attachment is defective. No mitotic delay occurs, and premature exit from mitosis results. Thus, substantial chromosome loss or nondisjunction occurs and presumably cell death will follow. (B) MAD2-depleted and 17-AAG–treated cells have abnormal nuclei. After 48 h of transfection with MAD2 siRNA, HeLa cells were incubated with 17-AAG (500 nM) for 24 h at 37°C. Cells were fixed, and DNA was visualized by staining with DAPI (blue). Type 1 refers to fragmented and aggregated nuclei; type 2, to micronuclei (arrows); and type 3, to chromosome bridges (arrowheads). Bars, 10 μm. (C) The siRNA dilution experiment using MAD2 targets that deplete MAD2 almost completely. (Top) Quantified MAD2 expression levels are shown. The X-axis indicates dilutions of MAD2 siRNA oligos. The Y-axis indicates the remaining MAD2 signals. (Middle) The mitotic index induced by 17-AAG is reduced as MAD2 is depleted. (Bottom) The number of 17-AAG–induced abnormal nuclei also increased in proportion as MAD2 is depleted. (D, top) The mitotic index induced by NOC is reduced as MAD2 is depleted. (bottom) The number of NOC-induced abnormal nuclei also increased in proportion as MAD2 is depleted.
Figure 3.
Figure 3.
CIMD occurs in BUB1-depleted cells in the presence of microtubule inhibitors or 17-AAG. (A) A model showing BUB1-depleted cells. When cells had defective kinetochore–microtubule attachment, mitotic delay occurred, and the spindle checkpoint appeared to be active (ON). The substantial synthetic lethality cannot be explained because there is no premature exit from mitosis. (B) HeLa cells that are BUB1-depleted and 17-AAG–treated exhibit DNA fragmentation (TUNEL+) during mitosis. 48 h after HeLa cells were transfected with siRNA against MAD2, BUB1, or Luc, they were incubated with 17-AAG (+17AAG, 500 nM) for 24 h at 37°C. Fixed samples were stained by using an in situ cell death detection system that contained TMR red (red), an anti-phosphorylated histone H3 (p-H3) mouse monoclonal antibody, and FITC-conjugated secondary antibodies (green). DNA was stained with DAPI (blue) to visualize prophase, prometaphase, and metaphase cells. Bar, 10 μm. (C) A histogram summarizing TUNEL assay results of BUB1- or MAD2-depleted cells. HeLa cells transfected with siRNA against MAD2, BUB1, or Luc were treated with 17-AAG (500 nM), NOC (0.5 μg/ml), or Taxol (10 nM) for 24 h at 37°C. DNA fragmentation was detected by the TUNEL assay, and samples underwent indirect fluorescence microscopy using anti–p-H3 as a primary antibody. More than 200 cells in three independent experiments were counted, and the mean percentages (± SD) of TUNEL+ cells and mitotic TUNEL+ cells (mitotic cells were those that were positive for p-H3 and had characteristic chromosome morphology) were calculated. Gray bars represent the mean percentages of TUNEL+ cells in the population, and black bars indicate the mean percentages of mitotic TUNEL+ cells. (D) Almost 90% of the BUB1-depleted mitotic cells that were treated with 17-AAG, NOC, or Taxol were TUNEL+. A histogram summarizing TUNEL assay results of 17-AAG-treated and BUB1- or MAD2-depleted mitotic cells is shown in C. The number of TUNEL+ cells among more than 200 mitotic cells was counted, and the percentages (i.e., the number of mitotic TUNEL+ cells per that of total mitotic cells) are shown. MAD2 or Luc siRNA did not induce any mitotic TUNEL+ cells. (E) DNA fragmentation in BUB1-depleted and 17-AAG–treated mitotic HeLa cells was detected by electrophoresis. 48 h after HeLa cells were transfected with BUB1 siRNA, they were treated with 17-AAG (500 nM) for 6 h. Mitotic cells were isolated by pipetting (∼90% of the isolated population consisted of mitotic cells), and DNA was extracted and subjected to electrophoresis in a 1% agarose gel (lane 2). As a negative control, DNA extracted from mitotic HeLa cells treated with 17-AAG (500 nM) was loaded (lane 1); and as a positive control, we loaded DNA extracted from HeLa cells treated with staurosporine (1 μM), a known inducer of apoptosis (lane 3). The molecular size markers (1-kb DNA ladder; New England Biolabs) are indicated (lane M). Fragmented DNA prepared from the same amount of cells was loaded into each lane. Our method of DNA isolation isolated only fragmented DNA; therefore, if cells contained little or no fragmented DNA, the same was observed in that lane. (F) A model showing BUB1-depleted cells in which defects in kinetochore–microtubule attachment induce lethal DNA fragmentation. Because cells are still arrested in mitosis, the mitotic index is unchanged. Therefore, the spindle checkpoint appears to be active (ON).
Figure 4.
Figure 4.
CIMD is independent of caspase and p53 but dependent on p73. (A) Mitotic cell death induced by BUB1 siRNA and 17-AAG treatment did not activate caspases. 48 h after transfection of HeLa cells with BUB1 or Luc siRNA, they were incubated with 17-AAG (500 nM) for 24 h at 37°C. As a positive control, HeLa cells were treated with 1 μM staurosporine (STS) for 6 h. Cells were incubated in the FAM-VAD-FMK FLICA (fluorochrome inhibitor of caspases) solution (Immunochemistry Technologies, LLC) for 60 min at 37°C to detect activated caspases 1, and 3–9. Samples were examined under a fluorescent microscope, and the number of FLICA+ cells among more than 200 cells was counted. The calculated percentages are shown. Black bars represent the mean percentages (± SD) of interphase FLICA+ cells, whereas gray bars indicate the mean percentage (± SD) of all cells that were FLICA+. No mitotic FLICA+ (striped bars) were observed. (B) Pan-caspase inhibitors VAD (zVAD; 50 μM) or BAF (50 μM) did not suppress mitotic cell death induced by BUB1 siRNA and 17-AAG treatment. Black bars represent the mean percentages (± SD) of mitotic TUNEL+ cells, whereas gray bars indicate the mean percentage (± SD) of all TUNEL+ cells. Pan-caspase inhibitors zVAD (50 μM) or BAF (50 μM) were applied 1 h before 17-AAG treatment, and they remained in the medium during 17-AAG treatment. (C) CIMD is independent of p53. DNA fragmentation that was caused by BUB1 depletion and treatment with 17-AAG or microtubule inhibitors occurred in p53 cells, i.e., HCT116-p53−/− cells. (D) Overexpression of the dominant-negative mutant p73DD can suppress CIMD. We transfected HeLa cells with p73a plasmid, p73DD plasmid, or GFP vector only. At 48 h after transfection, we treated cells with 17-AAG, NOC, or Taxol and incubated them for 24 h. Cells were fixed, and only GFP+ cells were detected under a microscope. (E) DNA fragmentation induced by BUB1 siRNA and 17-AAG or Taxol treatment was suppressed when p73 was depleted. HeLa cells were cotransfected with siRNA against BUB1 and Luc or BUB1 and one of three siRNAs against p73 (#1, #2, or #3). 48 h later, the cells were incubated with 17-AAG (500 nM) for 24 h at 37°C. Fixed samples were stained by using an in situ cell death detection system.
Figure 5.
Figure 5.
CIMD is dependent on EndoG and AIF. (A) BUB1 siRNA and 17-AAG treatment release EndoG from mitochondria of mitotic cells. Fixed cells were stained using anti-EndoG rabbit polyclonal antibody and anti–p-H3 mouse monoclonal antibody as primary antibodies. FITC- and Texas red–conjugated secondary antibodies (green and red signals, respectively) were added to visualize specific proteins. DNA was stained with DAPI (blue). Samples were analyzed by fluorescence microscopy, and images were captured. Bar, 10 μm. (B) HeLa cells transfected with MAD2 siRNA, BUB1 siRNA #1, BUB1 siRNA #2, or Luc siRNA were treated with 17-AAG (500 nM), NOC (0.5 μg/ml), or Taxol (10 nM) for 24 h at 37°C. The number of mitotic EndoG-releasing cells was counted among more than 200 cells; mitotic cells were those that were p-H3+ and had characteristic chromosome morphology. The mean percentages (± SD) are shown. EndoG was not released in cells treated with siRNA against MAD2 or Luc. (C) An anti–apoptosis-inducing factor (AIF; green) rabbit polyclonal antibody was used to detect the release of AIF from mitochondria in response to BUB1 siRNA and 17-AAG treatment. Bar, 10 μm. (D) Bars represent the percentages of the mitotic AIF-releasing cells (i.e., cells positive for AIF release p-H3 and mitotic condensed chromosomes). AIF was not released from cells treated with siRNAs against MAD2 or Luc. (E) DNA fragmentation induced by BUB1 siRNA and 17-AAG treatment was suppressed when EndoG and AIF were depleted. HeLa cells were cotransfected with BUB1 siRNA and Luc siRNA; BUB1 siRNA and EndoG siRNA; BUB1 siRNA and AIF siRNA; or Luc siRNA. 48 h later, the cells were incubated with 17-AAG (500 nM) for 24 h at 37°C. Fixed samples were stained using an in situ cell death detection system, and TUNEL signals (black bars) were quantified by using Openlab version 4.0.4. Scientific Imaging Software (Improvision). (F) Depletion of EndoG and AIF rescues the lethality of cells treated with 17-AAG and BUB1 siRNA. Results from colony outgrowth assays of HeLa cells transfected with siRNAs directed against the indicated proteins are shown. We normalized the percent viability; the percentage of surviving colonies in control wells (Luc siRNA and no drug) was set to 100. Three independent experiments were performed.
Figure 6.
Figure 6.
CIMD occurs rapidly after defects in kinetochore–microtubule attachment occur. (A) 48 h after HeLa cells were transfected with BUB1 siRNA, they were incubated with ICRF187 (1 mM) for 6 h at 37°C. Mitotic cells were collected, and 17-AAG, NOC, or Taxol was added. TUNEL assays were performed at 0, 10, 20, and 40 min, and 1, and 2 h after the addition of 17-AAG, NOC, or Taxol. (B) 48 h after HeLa cells were transfected with BUB1 siRNA, they were incubated with ICRF187 (1 mM) for 6 h at 37°C. Mitotic cells were collected, and the temperature was shifted from 37 to 23°C. TUNEL assays were performed at 0, 10, 20, and 40 min, and 1, 2, and 3 h after the temperature shift. (C) Live-image analysis of BUB1-depleted cells after treatment with 17-AAG. Phase-contrast images were taken at the indicated time points after addition of 17-AAG. (Top and middle) Examples of BUB1-depleted cells that collapsed during mitosis. (Bottom) Examples of Luc siRNA–treated cells arrested in mitosis for 8 h. (D) The fate of the cells in which CIMD occurred. The morphologic phenotypes that were observed for 12 h after addition of 17-AAG were categorized into four types: those that collapsed during mitosis (gray), those that arrested in mitosis (striped), those that entered G1 (white), and those that entered G1 and collapsed (black). (E) Time course of mitotic collapse within 12 h after addition of 17-AAG. Bars indicate the percentages of the mitotic cells that collapsed at the indicated time points out of the mitotic cells that eventually collapsed. (F) Electron microscopy images of BUB1-depleted cells that were treated with 17-AAG for 3 h. Orthodox or swollen mitochondria (black arrowheads), condensed mitochondria (white arrowheads), whorls or onion-skin mitochondria (white arrows), and autophagosomes (asterisks) are indicated. Bar, 1 μm. (G) Histogram of mitochondrial cross-sectional areas in images of treated and control cells. The cross-sectional area, measured with the program ImageJ, is an estimate of the volume of the mitochondria. Mitochondria were classified according to orthodox and condensed morphology. The condensed mitochondria not only had a condensed matrix but also were smaller than the orthodox mitochondria in the same cells. The control (17AAG_Luc siRNA) samples had orthodox but few condensed mitochondria, hence the cross-sectional area was measured for only the orthodox mitochondria. Both the 17AAG_BUBsiRNA and Tax_BUBsiRNA cross-sectional areas were ∼3 times less than the control, suggesting that fission of the mitochondria occurred. Error bars represent the SEM. The value over the error bar is the number of mitochondria measured per condition.
Figure 7.
Figure 7.
Partial BUB1 depletion induces CIMD. (A) The siRNA dilution experiment using BUB1 targets that deplete BUB1 almost completely. Percentages indicate dilutions, e.g., 100% means no dilution and 0% means no oligo was used. A different siRNA oligo set was used for 100%-2. (Top) Western blotting using anti-BUB1 antibody. (Bottom) Quantified BUB1 expression levels are shown. The X-axis indicates dilutions of BUB1 siRNA oligos. The Y-axis indicates the remaining BUB1 signals. (B) Mitotic index and mitotic TUNEL+ cells (CIMD/mitotic cells) are shown. CIMD cells or the mitotic index is significantly reduced when BUB1 is depleted almost completely (100% and 100%-2). These data indicate that complete depletion of BUB1, like that of MAD2, causes premature mitotic exit. (C) The number of abnormal nuclei also increased to that seen after MAD2 depletion. (D) A kinase-dead BUB1 mutant failed to suppress CIMD. Ecotopic expression of wild-type (WT) BUB1 but not a kinase-dead mutant BUB1K821A (Cahill et al., 1998) suppresses CIMD when siRNA targets the 3′-UTR region of BUB1. (E) TUNEL assays were performed on three tumor cell lines with CIN (Caco-2, SW480, and HT29) and on three tumor cells lines with MIN (SW48, DLD-1, and HCT116) treated with 17-AAG (500 nM), NOC (0.5 mg/ml), or Taxol (10 nM) for 24 h at 37°C. Note that BUB1 was not depleted in these experiments. The number of TUNEL+ cells among more than 200 cells was counted. Bars represent the mean percentages (± SD) of TUNEL+ mitotic cells. Three independent experiments were performed. (F) The BUB1 level of expression in the cells from tumors with CIN was lower than that in the cells from tumors with MIN or that in HeLa cells. Approximately 30 μg of each cell lysate was loaded, and immunoblotting was performed using anti-BUB1 antibody. Anti-GAPDH served as a loading control. (G) Overexpression of BUB1 suppressed CIMD in three colon cancer cell lines with CIN. We transfected each cell line that exhibited CIN with pBI-GFP-BUB1-WT mammalian expression vector that expresses BUB1. At 24 h after AMAXA nucleofector transfection, we incubated cells with Taxol and continued incubation for 24 h. Cells were fixedand only GFP+ cells were detected. We observed that only Taxol-treated and BUB1-expressing cells suppressed CIMD in the condition that induced CIMD in the cells transfected with the GFP control vector. (H) Overexpression of a dominant-negative mutant of Bub1 (Bub1*V400) induces CIMD. We transfected HeLa cells with pBI-GFP-Bub1-V400 mammalian expression vector that expresses the mutant (the N-terminal region of BUB1) that was found in a tumor with CIN (Cahill et al., 1998). At 48 h after transfection, we treated cells with NOC and incubated them for another 24 h. Cells were fixed and only GFP+ cells were detected.
Figure 8.
Figure 8.
A model of the checkpoint function of BUB1. (A) BUB1 functions upstream of MAD2; the checkpoint signaling pathway is presumably more complicated, but the fate (i.e., type of death) of the cells is the focus in this model. Purple arrows indicate the events that occur when the proteins fail to perform their functions. When defects in the kinetochore-microtubule attachment occur in BUB1-depleted cells, the cells enter CIMD. If MAD2 is absent, chromosomes are lost or gained. The resulting aneuploid cells then enter the subsequent G1 phase, and apoptosis, mitotic catastrophe–like death, or reproductive death occurs. (B) If the model in A is correct, then when BUB1 and MAD2 functions are disrupted, CIMD occurs, because BUB1 function is upstream in the pathway. MAD2 depletion did not substantially affect CIMD induced by BUB1 depletion, which strongly supports the model in A.

Similar articles

Cited by

References

    1. Asnaghi, L., A. Calastretti, A. Bevilacqua, I. D'Agnano, G. Gatti, G. Canti, D. Delia, S. Capaccioli, and A. Nicolin. 2004. Bcl-2 phosphorylation and apoptosis activated by damaged microtubules require mTOR and are regulated by Akt. Oncogene. 23:5781–5791. - PubMed
    1. Babu, J.R., K.B. Jeganathan, D.J. Baker, X. Wu, N. Kang-Decker, and J.M. van Deursen. 2003. Rae1 is an essential mitotic checkpoint regulator that cooperates with Bub3 to prevent chromosome missegregation. J. Cell Biol. 160:341–353. - PMC - PubMed
    1. Banerji, U., A. O'Donnell, M. Scurr, S. Pacey, S. Stapleton, Y. Asad, L. Simmons, A. Maloney, F. Raynaud, M. Campbell, et al. 2005. Phase I pharmacokinetic and pharmacodynamic study of 17-allylamino, 17-demethoxygeldanamycin in patients with advanced malignancies. J. Clin. Oncol. 23:4152–4161. - PubMed
    1. Barni, S., L. Sciola, A. Spano, and P. Pippia. 1996. Static cytofluorometry and fluorescence morphology of mitochondria and DNA in proliferating fibroblasts. Biotech. Histochem. 71:66–70. - PubMed
    1. Barsoum, M.J., H. Yuan, A.A. Gerencser, G. Liot, Y. Kushnareva, S. Graber, I. Kovacs, W.D. Lee, J. Waggoner, J. Cui, et al. 2006. Nitric oxide-induced mitochondrial fission is regulated by dynamin-related GTPases in neurons. EMBO J. 25:3900–3911. - PMC - PubMed

Publication types

MeSH terms

Substances