. 2007 Jul 16;178(2):269-81.
doi: 10.1083/jcb.200702141. Epub 2007 Jul 9.

Molecular mechanisms of microtubule-dependent kinetochore transport toward spindle poles

Affiliations

Molecular mechanisms of microtubule-dependent kinetochore transport toward spindle poles

Kozo Tanaka et al. J Cell Biol. .

Abstract

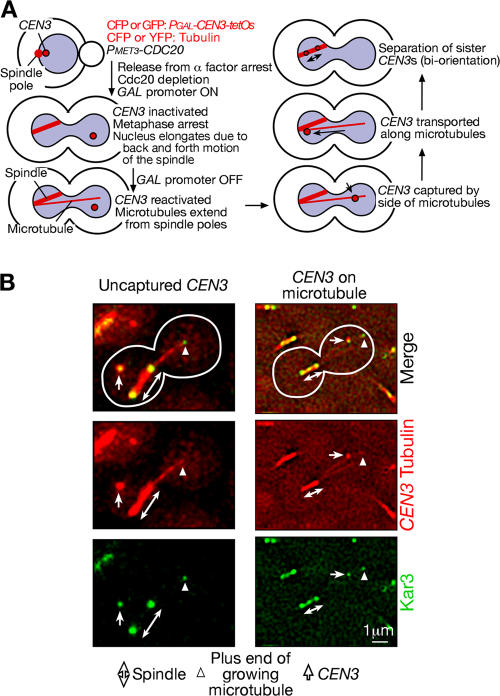
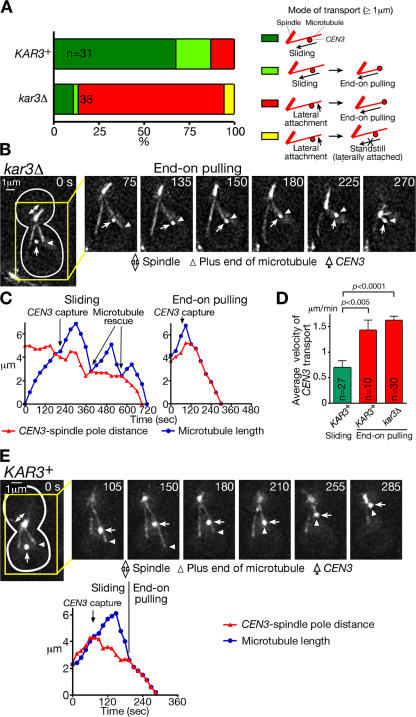
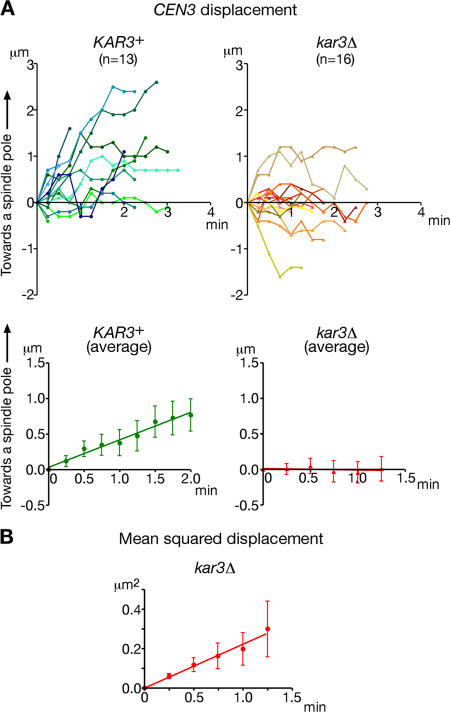
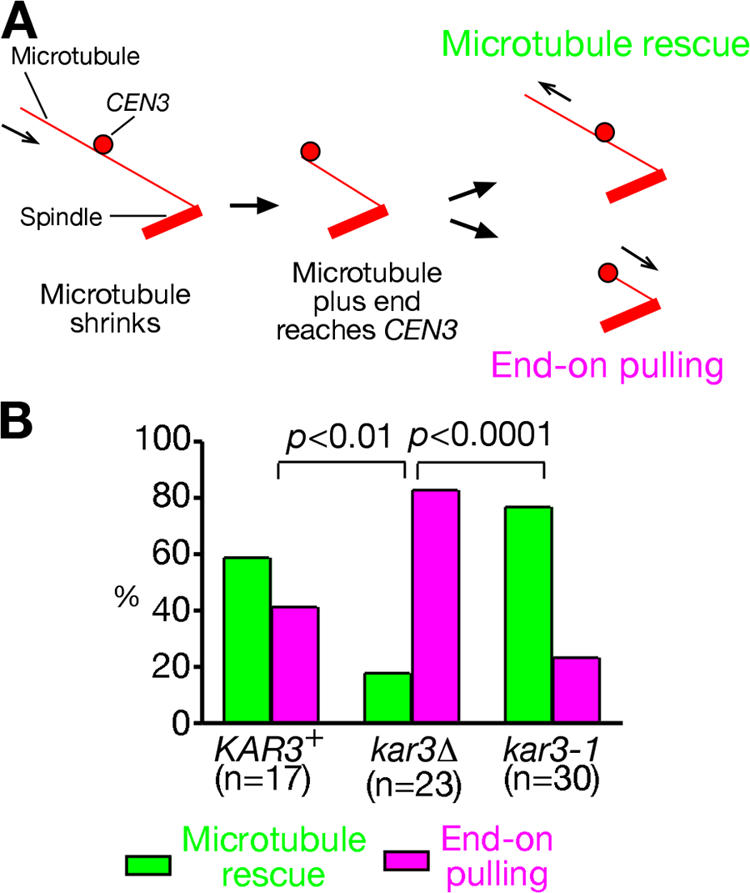
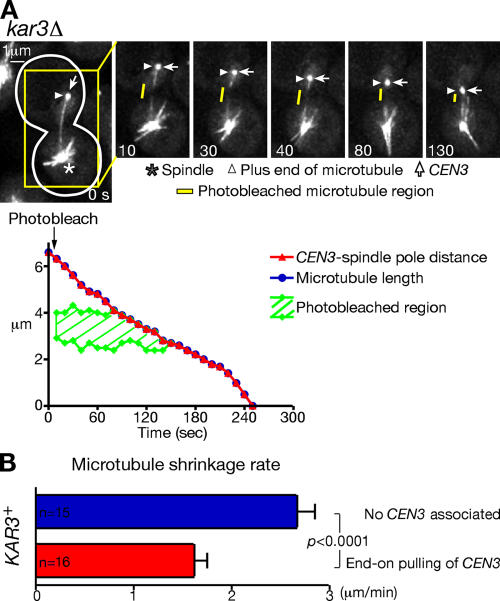
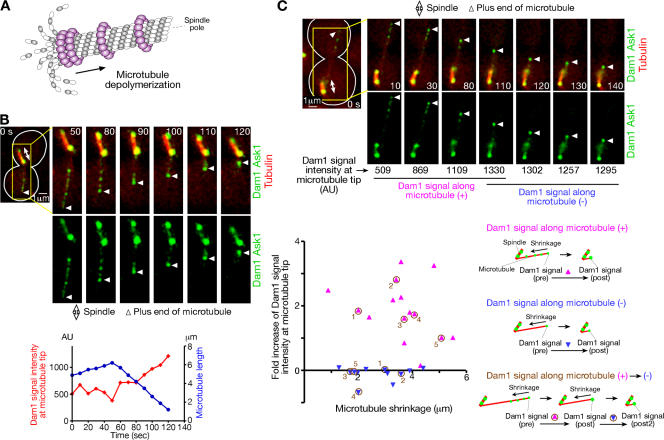
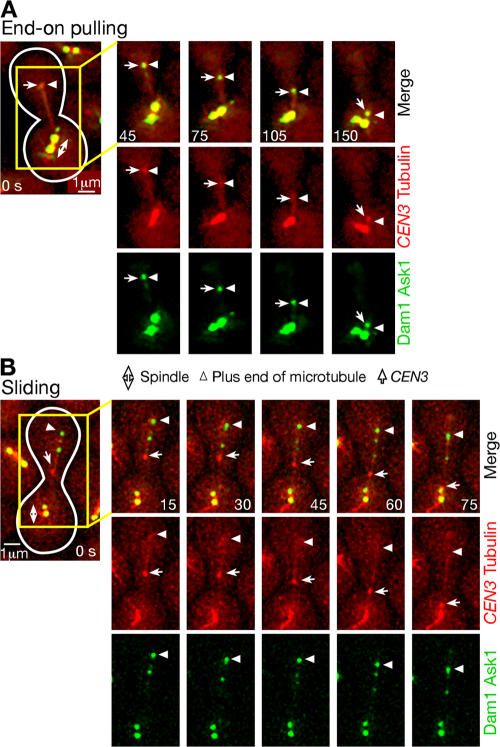
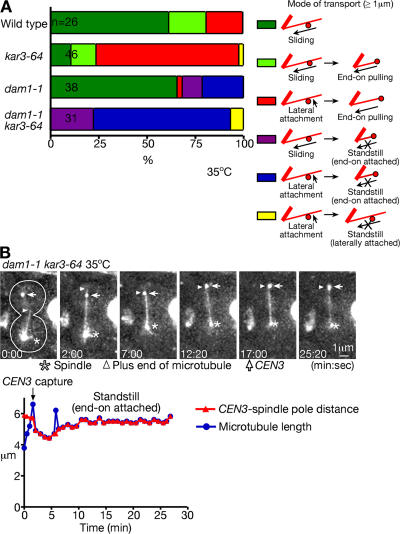
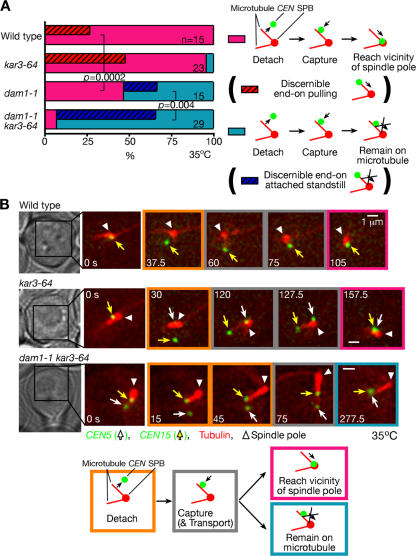
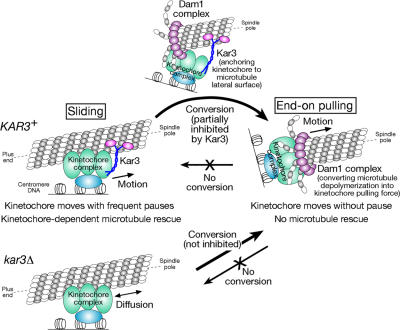
In mitosis, kinetochores are initially captured by the lateral sides of single microtubules and are subsequently transported toward spindle poles. Mechanisms for kinetochore transport are not yet known. We present two mechanisms involved in microtubule-dependent poleward kinetochore transport in Saccharomyces cerevisiae. First, kinetochores slide along the microtubule lateral surface, which is mainly and probably exclusively driven by Kar3, a kinesin-14 family member that localizes at kinetochores. Second, kinetochores are tethered at the microtubule distal ends and pulled poleward as microtubules shrink (end-on pulling). Kinetochore sliding is often converted to end-on pulling, enabling more processive transport, but the opposite conversion is rare. The establishment of end-on pulling is partly hindered by Kar3, and its progression requires the Dam1 complex. We suggest that the Dam1 complexes, which probably encircle a single microtubule, can convert microtubule depolymerization into the poleward kinetochore-pulling force. Thus, microtubule-dependent poleward kinetochore transport is ensured by at least two distinct mechanisms.


Figures

Figure 1.
Figure 1.
Localization of Kar3 at kinetochores. (A) Experimental system to analyze kinetochore capture and transport by individual microtubules in budding yeast. See details in K. Tanaka et al. (2005) and in the first paragraph of Results. (B) Kar3 localizes at kinetochores before their capture by microtubules (left) and during their transport along microtubules (right). KAR3-4GFP CFP-TUB1 PGAL-CEN3-tetOs TetR-3CFP PMET3-CDC20 cells (T3733) were treated with α factor in methionine drop-out medium with raffinose for 2.5 h and released to YP medium containing galactose, raffinose, and 2 mM methionine. After 3 h, cells were suspended in synthetic complete medium containing glucose and methionine (K. Tanaka et al., 2005). After 3 min, GFP (Kar3; green) and CFP (CEN3 tubulin; red) images were collected. Bidirectional arrows, arrowheads, and arrows indicate metaphase spindle, plus ends of growing microtubules, and CEN3, respectively.
Figure 2.
Figure 2.
Kinetochores are tethered at the ends of microtubules and are transported poleward as microtubules shrink. KAR3+ (wild-type KAR3; T3531) and kar3Δ (T3860) cells with YFP-TUB1 PGAL-CEN3-tetOs TetR-GFP PMET3-CDC20 were treated as in Fig 1. (A) Percentages of cells in which CEN3 was transported with each mode as colored/illustrated. Sliding and end-on pulling were scored only when CEN3 moved for 1 μm or more by each mode of transport; standstill was scored when CEN3 was at almost the same position on microtubules for considerable time (supplemental note 30). (B) Representative time-lapse images of the microtubule end-on pulling of CEN3. GFP and YFP images were acquired together in T3860 cells. See Video 1 (available at http://www.jcb.org/cgi/content/full/jcb.200702141/DC1). (C) Distance of CEN3 from a spindle pole (red) and length of the microtubule that captured CEN3 (blue) during sliding (left) and end-on pulling (right; images shown in B) of CEN3 in representative KAR3+ and kar3Δ cells, respectively. Sliding in kar3Δ and end-on pulling in KAR3+ also occurred similarly (not depicted). (D) The mean velocity of CEN3 transport by sliding (KAR3+) and end-on pulling (KAR3+ and kar3Δ). Error bars represent SEM. (E) Conversion of CEN3 sliding along a microtubule into microtubule end-on pulling in a representative KAR3+ cell. See Video 2. Such conversion also occurred similarly in kar3Δ cells (not depicted).
Figure 3.
Figure 3.
Kar3 is the main and probably the sole factor driving kinetochore sliding along microtubules. (A) The position of CEN3 was plotted for a short period, during which it was associated with the microtubule lateral surface but not at the microtubule distal end after its initial capture by a microtubule lateral surface in KAR3+ and kar3Δ cells (supplemental note 6, available at http://www.jcb.org/cgi/content/full/jcb.200702141/DC1). T3531 and T3860 cells (see Fig 2) were treated as in Fig 1. (top) Each line represents the time-course trajectory of CEN3 along a microtubule in an individual cell. On the y axis and x axis of the graphs, zero represents the original CEN3 position when initially captured by a microtubule and the time of this capture, respectively; y axis positive values designate CEN3 motion toward a spindle pole along a microtubule. (bottom) The displacement of CEN3 from its original position along a microtubule was averaged among different cells. (B) The MSD, which was averaged among different cells, was plotted against a change of time in kar3Δ cells. Error bars represent SEM.
Figure 4.
Figure 4.
Kar3 partially suppresses the establishment of the microtubule end-on pulling of kinetochores. (A) Immediately after the distal end of a shrinking microtubule encountered CEN3 that had been on its lateral side, the microtubule showed rescue, and CEN3 stayed attached to the lateral surface (microtubule rescue); alternatively, CEN3 became bound to the plus end of the microtubule and was pulled poleward as the microtubule continued to shrink (end-on pulling). (B) Frequency of microtubule rescue (green bars) and end-on pulling (pink bars), as described in A, was scored in KAR3+, kar3Δ, and kar3-1 cells. T3531, T3860 (see Fig. 2). and T3319 (the same genotype as T3531 but kar3-1) cells were treated as in Fig 1.
Figure 5.
Figure 5.
Microtubule dynamics during the end-on pulling of kinetochores. (A) Microtubules depolymerize at their plus ends during the end-on pulling of CEN3. kar3Δ (T3860; see Fig 2) cells were treated as in Fig 1. A microtubule region midway between CEN3 (bound at the microtubule plus end) and a spindle pole was photobleached between time points 0 and 10 s. GFP (CEN3) and YFP (tubulin) signals were acquired together every 10 s. Yellow bars show a photobleached region. The graph shows the distance of CEN3 from a spindle pole (red), length of the microtubule that captured CEN3 (blue), and the photobleached region (green) during the microtubule end-on pulling of CEN3. (B) Microtubule shrinkage rate in the absence of CEN3 associated with the microtubule (blue) and during the microtubule end-on pulling of CEN3 (red). KAR3+ (T3531; see Fig 2) cells were treated as in Fig 1. Error bars represent SEM.
Figure 6.
Figure 6.
Localization of the Dam1 complexes at the microtubule plus end. (A) Schematic diagram of microtubule depolymerization and possible localization of the Dam1 complexes. (B) The Dam1 complexes accumulate at the end of a microtubule as it depolymerizes. (top) Representative time-lapse images of Dam1 complex localization during microtubule shrinkage. (bottom) Length of the microtubule (blue) and intensity of Dam1 and Ask1 GFP signals at the microtubule distal end (red). DAM1-4GFP ASK1-4GFP CFP-TUB1 PGAL-CEN3-tetOs TetR-3CFP PMET3-CDC20 cells (T4991) were treated as in Fig. 1 except that glucose-containing media were used throughout the experiment (i.e., CEN3 was continuously active). CFP (CEN3, tubulin; red) and GFP (the Dam1 complex; green) images were acquired every 10 s. AU, arbitrary unit. See Video 3. (C) The Dam1 complexes along a microtubule are collected at its plus end. T4991 cells were treated as in B. The Dam1 complex signal (Dam1-4GFP and Ask1-4GFP) at the microtubule plus end was quantified, and its fold increase during microtubule shrinkage was plotted against the extent of this shrinkage in the presence (pink) and absence (blue) of the Dam1 complexes along the microtubule. Fold increase was calculated by dividing the increase of the signal intensity (pre→post or post→post 2) by pre-signal intensity. Numbers in brown represent each microtubule in which the fold increase was measured consecutively (microtubule #3 is shown in the images). For more information, see supplemental note 31 (available at http://www.jcb.org/cgi/content/full/jcb.200702141/DC1).
Figure 7.
Figure 7.
Continuous colocalization of the Dam1 complex with a centromere during end-on puling but not during sliding. (A and B) The Dam1 complexes continuously colocalize with CEN3 during end-on pulling (A) but not during sliding (B). T4991 cells (see Fig. 6) were treated as in Fig. 1, and CFP and GFP images were acquired. See Videos 4 and 5 (available at http://www.jcb.org/cgi/content/full/jcb.200702141/DC1).
Figure 8.
Figure 8.
Both Kar3 and the Dam1 complex are involved in kinetochore transport. DAM1 + KAR3+ wild-type (T3531), dam1-1 (T2897), kar3-64 (T4034), and dam1-1 kar3-64 (T4044) cells with YFP-TUB1 PGAL-CEN3-tetOs TetR-GFP PMET3-CDC20 were treated as in Fig. 1 but with cultures shifted to 35°C 30 min before transfer to glucose-containing medium. Images were acquired every 10 s at 35°C. (A) Percentages of cells in which CEN3 was transported with each mode as colored/illustrated. Sliding, end-on pulling, and standstill were scored as in Fig. 2 A. (B, top) Representative time-lapse GFP and YFP images (acquired together) in T4044 cells. (bottom) CEN3–spindle pole distance (red) and length of the microtubule capturing CEN3 (blue). See Video 6 (available at http://www.jcb.org/cgi/content/full/jcb.200702141/DC1).
Figure 9.
Figure 9.
Kar3 and the Dam1 complex facilitate poleward kinetochore transport in normal S phase. DAM1 + KAR3+ wild-type (T4243), dam1-1 (T5057), kar3-64 (T5058), and dam1-1 kar3-64 (T5056) cells with YFP-TUB1 CEN5-tetOs TetR-3CFP CEN15-lacOs GFP-LacI were treated with α factor and subsequently released to fresh media at 35°C. Images were acquired every 7.5 s. With the applied filter set (JP3 filter; see Materials and methods), CFP/GFP and YFP were separately visualized, and the two CENs could be distinguished, as CEN5-CFP showed lower intensity than CEN15-GFP. The behavior of CEN5 and CEN15 was analyzed when they detached from and were subsequently recaptured by microtubules. (A) Percentage of CENs that did (pink) and did not (teal) swiftly reach (<2 min) the vicinity of the spindle pole (<0.6 μm from the spindle pole). Graphs also indicate the percentage of cells in which we could discern microtubule end-on pulling (red shaded areas) and end-on attached standstill (blue shaded areas) of either CEN5 or CEN15 (supplemental note 17). P-values were obtained by comparing the number of CENs, which are categorized in pink and teal bars. (B) Representative time-lapse images of a wild-type cell that showed swift CEN15 transport, a kar3-64 cell that showed the end-on pulling of CEN15, and a dam1-1 kar3-64 cell that showed CEN5 standstill at the microtubule end. The other CEN was sometimes out of focus and is therefore not indicated. White arrows, yellow arrows, and white arrowheads indicate CEN5, CEN15, and spindle poles, respectively. For more information, see supplemental note 32 (available at http://www.jcb.org/cgi/content/full/jcb.200702141/DC1).
Figure 10.
Figure 10.
Model for how kinetochores are transported by spindle microtubules. Poleward kinetochore transport occurs in two distinct ways: lateral sliding, in which kinetochores move along the side of a microtubule, and end-on pulling, in which the kinetochore is attached to the end of a microtubule and is pulled poleward as the microtubule shrinks. Kar3 is essential to drive poleward lateral sliding, whereas the Dam1 complex is crucial for end-on pulling. Kar3 partly suppresses the establishment of end-on pulling by anchoring kinetochores to the microtubule lateral surface. In the absence of Kar3 (kar3Δ), kinetochores show diffusion along the microtubule lateral surface.

Similar articles

Cited by

References

    1. Amberg, D.C., D.J. Burke, and J.N. Strathern. 2005. Methods in Yeast Genetics: a Cold Spring Harbor Laboratory Course Manual. Cold Spring Harbor Laboratory, Cold Spring Harbor, NY. 230 pp.
    1. Andrews, P.D., Y. Ovechkina, N. Morrice, M. Wagenbach, K. Duncan, L. Wordeman, and J.R. Swedlow. 2004. Aurora B regulates MCAK at the mitotic centromere. Dev. Cell. 6:253–268. - PubMed
    1. Asbury, C.L., D.R. Gestaut, A.F. Powers, A.D. Franck, and T.N. Davis. 2006. The Dam1 kinetochore complex harnesses microtubule dynamics to produce force and movement. Proc. Natl. Acad. Sci. USA. 103:9873–9878. - PMC - PubMed
    1. Cheeseman, I.M., C. Brew, M. Wolyniak, A. Desai, S. Anderson, N. Muster, J.R. Yates, T.C. Huffaker, D.G. Drubin, and G. Barnes. 2001. a. Implication of a novel multiprotein Dam1p complex in outer kinetochore function. J. Cell Biol. 155:1137–1145. - PMC - PubMed
    1. Cheeseman, I.M., M. Enquist-Newman, T. Muller-Reichert, D.G. Drubin, and G. Barnes. 2001. b. Mitotic spindle integrity and kinetochore function linked by the Duo1p/Dam1p complex. J. Cell Biol. 152:197–212. - PMC - PubMed

Publication types

MeSH terms

Substances