

Large-scale reorganization of the tonotopic map in mouse auditory midbrain revealed by MRI
- PMID: 17620614
- PMCID: PMC1913547
- DOI: 10.1073/pnas.0700960104
Large-scale reorganization of the tonotopic map in mouse auditory midbrain revealed by MRI
Abstract
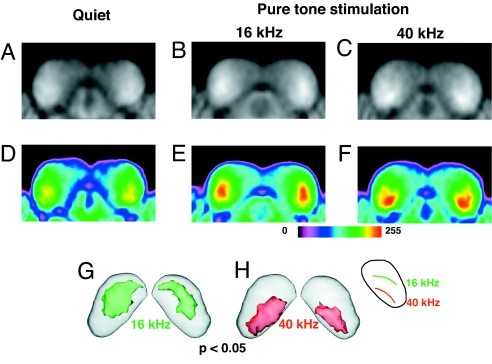
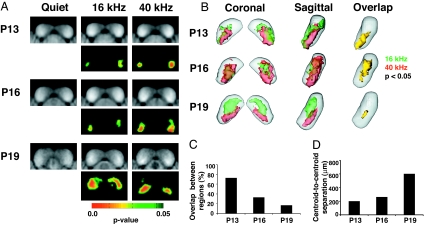
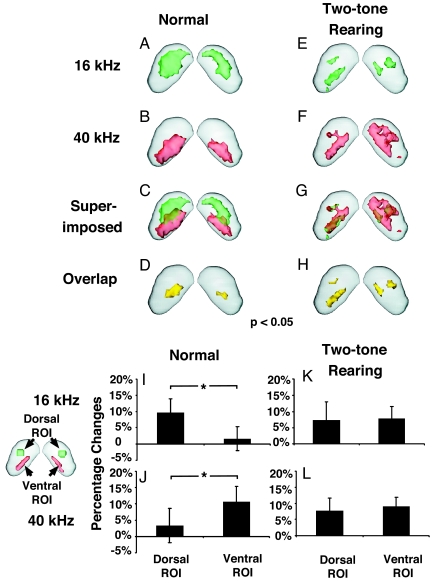
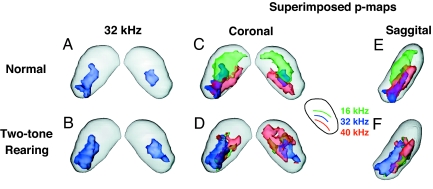
The cortex is thought to be the primary site of sensory plasticity, particularly during development. Here, we report that large-scale reorganization of the mouse auditory midbrain tonotopic map is induced by a specific sound-rearing environment consisting of paired low- (16 kHz) and high-frequency (40 kHz) tones. To determine the potential for plasticity in the mouse auditory midbrain, we used manganese-enhanced MRI to analyze the midbrain tonotopic maps of control mice during normal development and mice reared in the two-tone (16 + 40 kHz) environment. We found that the tonotopic map emerged during the third postnatal week in normal mice. Before 3 weeks, a larger percentage of auditory midbrain responded to each of the suprathreshold test frequencies, despite the fact that the primary afferent projections are in place even before hearing onset. By 3 weeks, the midbrain tonotopic map of control mice was established, and manganese-enhanced MRI showed a clear separation between the 16- and 40-kHz responses. Two-tone rearing dramatically altered the appearance of these discrete frequency-specific responses. A significant volume of the auditory midbrain became responsive to both rearing frequencies, resulting in a large-scale reorganization of the tonotopic map. These results indicate that developmental plasticity occurs on a much greater scale than previously appreciated in the mammalian auditory midbrain.
Conflict of interest statement
The authors declare no conflict of interest.
Figures
Similar articles
-
Midbrain Frequency Representation following Moderately Intense Neonatal Sound Exposure in a Precocious Animal Model (Chinchilla laniger).Neural Plast. 2016;2016:3734646. doi: 10.1155/2016/3734646. Epub 2016 Nov 8. Neural Plast. 2016. PMID: 27895941 Free PMC article.
-
Corticofugal reorganization of the midbrain tonotopic map in mice.Neuroreport. 2001 Oct 29;12(15):3313-6. doi: 10.1097/00001756-200110290-00033. Neuroreport. 2001. PMID: 11711877
-
Neurod1 Is Essential for the Primary Tonotopic Organization and Related Auditory Information Processing in the Midbrain.J Neurosci. 2019 Feb 6;39(6):984-1004. doi: 10.1523/JNEUROSCI.2557-18.2018. Epub 2018 Dec 12. J Neurosci. 2019. PMID: 30541910 Free PMC article.
-
Auditory cortex: comparative aspects of maps and plasticity.Curr Opin Neurobiol. 1991 Aug;1(2):236-47. doi: 10.1016/0959-4388(91)90084-k. Curr Opin Neurobiol. 1991. PMID: 1821187 Review.
-
Cortical tonotopic map reorganization and its implications for treatment of tinnitus.Acta Otolaryngol Suppl. 2006 Dec;(556):9-12. doi: 10.1080/03655230600895259. Acta Otolaryngol Suppl. 2006. PMID: 17114136 Review.
Cited by
-
Neurovascular responses to neuronal activity during sensory development.Front Cell Neurosci. 2022 Nov 11;16:1025429. doi: 10.3389/fncel.2022.1025429. eCollection 2022. Front Cell Neurosci. 2022. PMID: 36439201 Free PMC article.
-
Manganese-enhanced magnetic resonance imaging (MEMRI).Methods Mol Biol. 2011;711:145-74. doi: 10.1007/978-1-61737-992-5_7. Methods Mol Biol. 2011. PMID: 21279601 Free PMC article.
-
Monaural deprivation disrupts development of binaural selectivity in auditory midbrain and cortex.Neuron. 2010 Mar 11;65(5):718-31. doi: 10.1016/j.neuron.2010.02.019. Neuron. 2010. PMID: 20223206 Free PMC article.
-
Influences of un-modulated acoustic inputs on functional maturation and critical-period plasticity of the primary auditory cortex.Neuroscience. 2008 Jun 12;154(1):390-6. doi: 10.1016/j.neuroscience.2008.01.026. Epub 2008 Jan 25. Neuroscience. 2008. PMID: 18304741 Free PMC article.
-
Developmental plasticity in the human auditory brainstem.J Neurosci. 2008 Apr 9;28(15):4000-7. doi: 10.1523/JNEUROSCI.0012-08.2008. J Neurosci. 2008. PMID: 18400899 Free PMC article.
References
Publication types
MeSH terms
Grants and funding
LinkOut - more resources
Full Text Sources
Medical
