

Filopodia act as phagocytic tentacles and pull with discrete steps and a load-dependent velocity
- PMID: 17620618
- PMCID: PMC1913848
- DOI: 10.1073/pnas.0702449104
Filopodia act as phagocytic tentacles and pull with discrete steps and a load-dependent velocity
Abstract
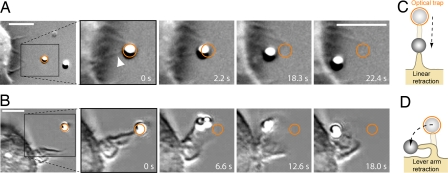
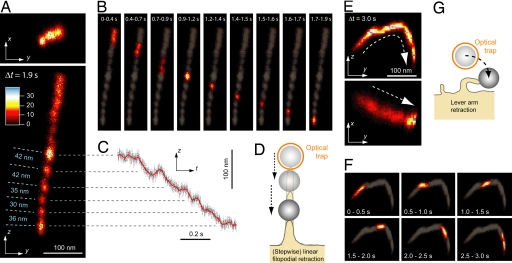
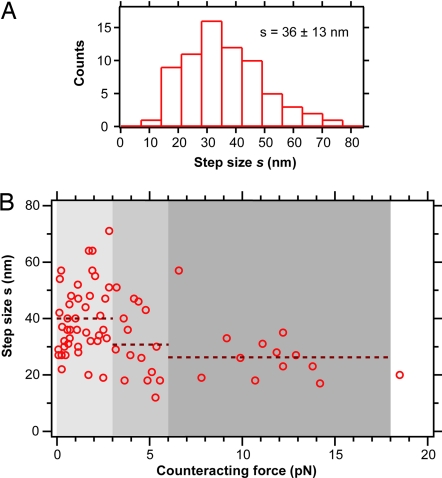
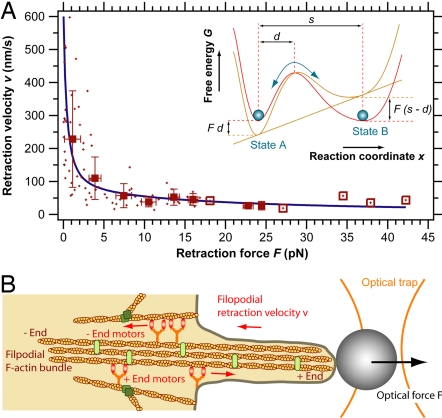
Filopodia are thin, spike-like cell surface protrusions containing bundles of parallel actin filaments. So far, filopodial dynamics has mainly been studied in the context of cell motility on coverslip-adherent filopodia by using fluorescence and differential interference contrast (DIC) microscopy. In this study, we used an optical trap and interferometric particle tracking with nanometer precision to measure the three-dimensional dynamics of macrophage filopodia, which were not attached to flat surfaces. We found that filopodia act as cellular tentacles: a few seconds after binding to a particle, filopodia retract and pull the bound particle toward the cell. We observed F-actin-dependent stepwise retraction of filopodia with a mean step size of 36 nm, suggesting molecular motor activity during filopodial pulling. Remarkably, this intracellular stepping motion, which was measured at counteracting forces of up to 19 pN, was transmitted to the extracellular tracked particle via the filopodial F-actin bundle and the cell membrane. The pulling velocity depended strongly on the counteracting force and ranged between 600 nm/s at forces <1 pN and approximately 40 nm/s at forces >15 pN. This result provides an explanation of the significant differences in filopodial retraction velocities previously reported in the literature. The measured filopodial retraction force-velocity relationship is in agreement with a model for force-dependent multiple motor kinetics.
Conflict of interest statement
The authors declare no conflict of interest.
Figures
Similar articles
-
Filopodial retraction force is generated by cortical actin dynamics and controlled by reversible tethering at the tip.Proc Natl Acad Sci U S A. 2013 Nov 19;110(47):18928-33. doi: 10.1073/pnas.1316572110. Epub 2013 Nov 6. Proc Natl Acad Sci U S A. 2013. PMID: 24198333 Free PMC article.
-
Multiple roles of filopodial dynamics in particle capture and phagocytosis and phenotypes of Cdc42 and Myo10 deletion.J Biol Chem. 2017 Apr 28;292(17):7258-7273. doi: 10.1074/jbc.M116.766923. Epub 2017 Mar 13. J Biol Chem. 2017. PMID: 28289096 Free PMC article.
-
Surfing along Filopodia: A Particle Transport Revealed by Molecular-Scale Fluctuation Analyses.Biophys J. 2015 May 5;108(9):2114-25. doi: 10.1016/j.bpj.2015.02.029. Biophys J. 2015. PMID: 25954870 Free PMC article.
-
How filopodia pull: what we know about the mechanics and dynamics of filopodia.Cytoskeleton (Hoboken). 2013 Oct;70(10):590-603. doi: 10.1002/cm.21130. Epub 2013 Sep 3. Cytoskeleton (Hoboken). 2013. PMID: 23959922 Review.
-
An updated look at actin dynamics in filopodia.Cytoskeleton (Hoboken). 2015 Feb;72(2):71-9. doi: 10.1002/cm.21216. Cytoskeleton (Hoboken). 2015. PMID: 25786787 Review.
Cited by
-
Engineering 3D Scaffold-Free Nanoparticle-Laden Stem Cell Constructs for Piezoelectric Enhancement of Human Neural Tissue Formation and Function.Adv Sci (Weinh). 2024 Oct;11(40):e2310010. doi: 10.1002/advs.202310010. Epub 2024 Jul 25. Adv Sci (Weinh). 2024. PMID: 39049737 Free PMC article.
-
Cell elasticity determines macrophage function.PLoS One. 2012;7(9):e41024. doi: 10.1371/journal.pone.0041024. Epub 2012 Sep 18. PLoS One. 2012. PMID: 23028423 Free PMC article.
-
An Acquired and Endogenous Glycocalyx Forms a Bidirectional "Don't Eat" and "Don't Eat Me" Barrier to Phagocytosis.Curr Biol. 2021 Jan 11;31(1):77-89.e5. doi: 10.1016/j.cub.2020.09.082. Epub 2020 Oct 22. Curr Biol. 2021. PMID: 33096038 Free PMC article.
-
Filopodia rotate and coil by actively generating twist in their actin shaft.Nat Commun. 2022 Mar 28;13(1):1636. doi: 10.1038/s41467-022-28961-x. Nat Commun. 2022. PMID: 35347113 Free PMC article.
-
Formation of cellular close-ended tunneling nanotubes through mechanical deformation.Sci Adv. 2022 Apr;8(13):eabj3995. doi: 10.1126/sciadv.abj3995. Epub 2022 Mar 30. Sci Adv. 2022. PMID: 35353579 Free PMC article.
References
Publication types
MeSH terms
Grants and funding
LinkOut - more resources
Full Text Sources
