doi: 10.1107/S174430910702533X.
Epub 2007 Jun 11.
The complex between SOS3 and SOS2 regulatory domain from Arabidopsis thaliana: cloning, expression, purification, crystallization and preliminary X-ray analysis
Affiliations
- PMID: 17620712
- PMCID: PMC2335134
- DOI: 10.1107/S174430910702533X
Item in Clipboard
The complex between SOS3 and SOS2 regulatory domain from Arabidopsis thaliana: cloning, expression, purification, crystallization and preliminary X-ray analysis
Acta Crystallogr Sect F Struct Biol Cryst Commun.
.
Abstract
The salt-tolerance genes SOS3 (salt overly sensitive 3) and SOS2 (salt overly sensitive 2) regulatory domain of Arabidopsis thaliana were cloned into a polycistronic plasmid and the protein complex was expressed in Escherichia coli, allowing purification to homogeneity in three chromatographic steps. Crystals were grown using vapour-diffusion techniques. The crystals belonged to space group P2(1)2(1)2(1), with unit-cell parameters a = 44.14, b = 57.39, c = 141.90 A.
Figures
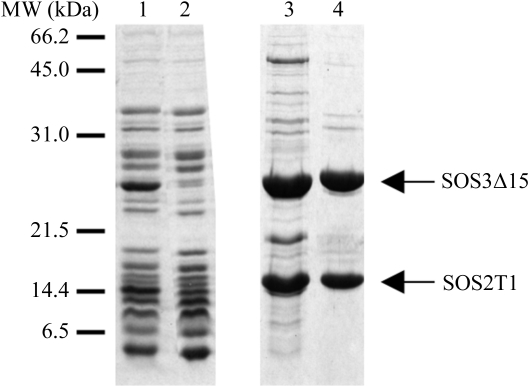
Expression and purification of the SOS3Δ15–SOS2T1 complex. Lane 1, flowthrough from the anion-exchange column. Lane 2, flowthrough from the cation-exchange column. Lane 3, the fraction eluted with 125 mM NaCl buffer from the cation-exchange column. Lane 4, the main peak from the permeability column. Proteins were analyzed using 15% SDS–PAGE gels. Gels were stained using Coomassie Brilliant Blue.
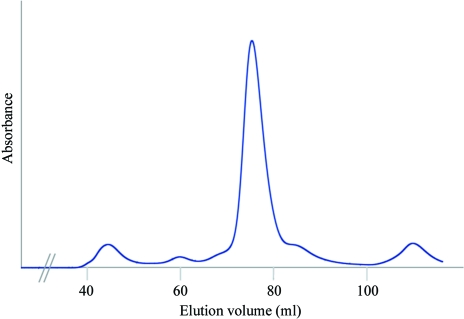
Gel-filtration chromatography of SOS3Δ15–SOS2T1. The line shows the absorbance recorded at 280 nm.
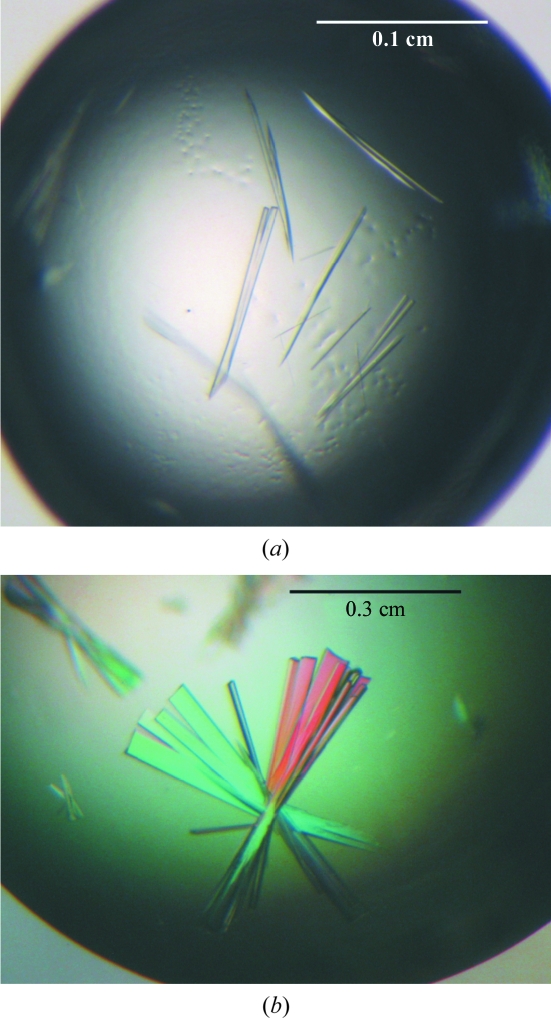
(a) SOS3Δ15–SOS2T1 crystals grown in 20%(w/v) PEG 4000, 0.1 M Tris–HCl pH 8.5, 0.2 M lithium sulfate. (b) Effect of ethylene glycol and guanidine–HCl on the crystals used in the study.
Similar articles
-
SOS3 (salt overly sensitive 3) from Arabidopsis thaliana: expression, purification, crystallization and preliminary X-ray analysis.Acta Crystallogr D Biol Crystallogr. 2004 Jul;60(Pt 7):1272-4. doi: 10.1107/S0907444904008728. Epub 2004 Jun 22. Acta Crystallogr D Biol Crystallogr. 2004. PMID: 15213389
-
Cloning, expression, purification, crystallization and preliminary crystallographic analysis of the kinase domain of AtMAP4Kalpha2 from Arabidopsis thaliana.Acta Crystallogr Sect F Struct Biol Cryst Commun. 2013 Jul;69(Pt 7):788-91. doi: 10.1107/S174430911301525X. Epub 2013 Jun 28. Acta Crystallogr Sect F Struct Biol Cryst Commun. 2013. PMID: 23832209 Free PMC article.
-
SnRK2.6/OST1 from Arabidopsis thaliana: cloning, expression, purification, crystallization and preliminary X-ray analysis of K50N and D160A mutants.Acta Crystallogr Sect F Struct Biol Cryst Commun. 2011 Mar 1;67(Pt 3):364-8. doi: 10.1107/S1744309110053807. Epub 2011 Feb 25. Acta Crystallogr Sect F Struct Biol Cryst Commun. 2011. PMID: 21393844 Free PMC article.
-
Crystallization and preliminary crystallographic analysis of a C2 protein from Arabidopsis thaliana.Acta Crystallogr Sect F Struct Biol Cryst Commun. 2011 Dec 1;67(Pt 12):1575-8. doi: 10.1107/S1744309111040541. Epub 2011 Nov 26. Acta Crystallogr Sect F Struct Biol Cryst Commun. 2011. PMID: 22139170 Free PMC article.
-
The SOS3 family of calcium sensors and SOS2 family of protein kinases in Arabidopsis.Plant Physiol. 2004 Mar;134(3):919-26. doi: 10.1104/pp.103.037440. Plant Physiol. 2004. PMID: 15020756 Free PMC article. Review. No abstract available.
Cited by
-
Ion Transporters and Abiotic Stress Tolerance in Plants.ISRN Mol Biol. 2012 Jun 3;2012:927436. doi: 10.5402/2012/927436. eCollection 2012. ISRN Mol Biol. 2012. PMID: 27398240 Free PMC article. Review.
-
Structural Biology of a Major Signaling Network that Regulates Plant Abiotic Stress: The CBL-CIPK Mediated Pathway.Int J Mol Sci. 2013 Mar 12;14(3):5734-49. doi: 10.3390/ijms14035734. Int J Mol Sci. 2013. PMID: 23481636 Free PMC article.
References
Publication types
MeSH terms
Substances
LinkOut - more resources
Full Text Sources
Molecular Biology Databases
Miscellaneous