

MALDI-ion mobility-TOFMS imaging of lipids in rat brain tissue
- PMID: 17621389
- PMCID: PMC2953759
- DOI: 10.1002/jms.1245
MALDI-ion mobility-TOFMS imaging of lipids in rat brain tissue
Abstract
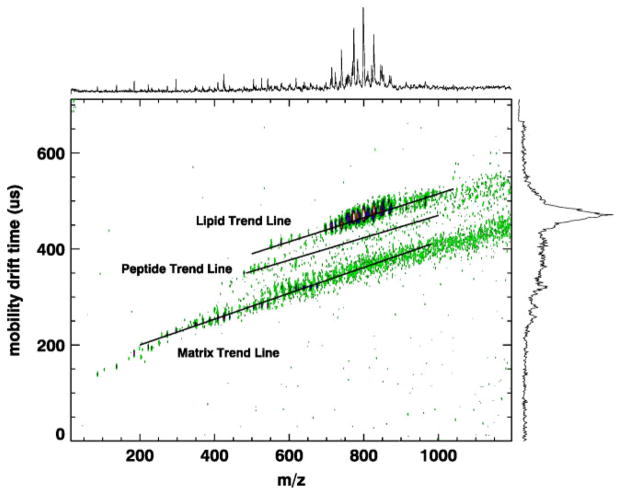
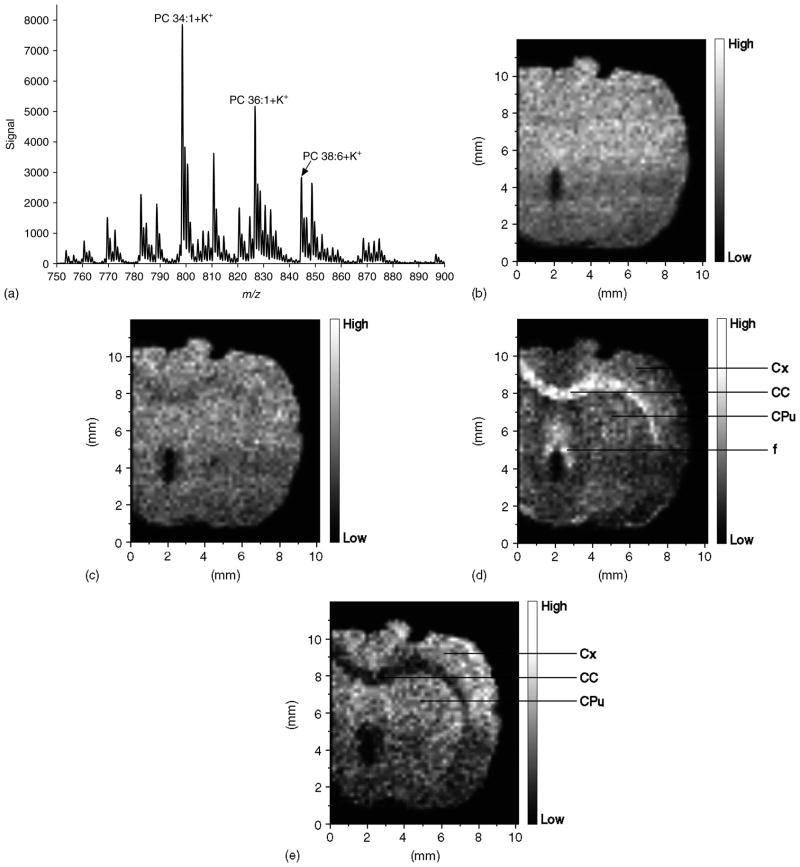
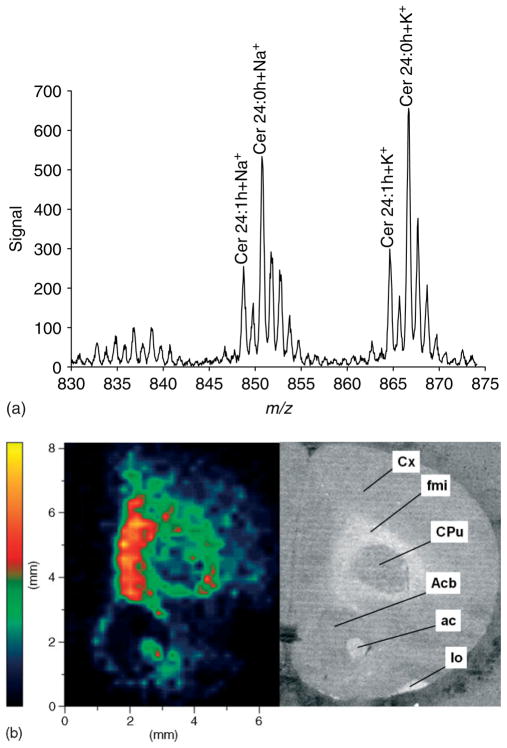
While maintaining anatomical integrity, matrix assisted laser desorption/ionization mass spectrometry (MALDI-MS) has allowed researchers to directly probe tissue, map the distribution of analytes and elucidate molecular structure with minimal preparation. MALDI-ion mobility (IM)-orthogonal time-of-flight mass spectrometry (oTOFMS) provides an advantage by initially separating different classes of biomolecules such as lipids, peptides, and nucleotides by their IM drift times prior to mass analysis. In the present work the distribution of phosphatidlycholine and cerebroside species was mapped from 16 microm thick coronal rat brain sections using MALDI-IM-oTOFMS. Furthermore, the use of gold nanoparticles as a matrix enables detection of cerebrosides, which although highly concentrated in brain tissue, are not easily observed as positive ions because of intense signals from lipids such as phosphatidlycholines and sphingomyelins.
Figures
References
-
- Reyzer ML, Caprioli RM. MALDI-MS-based imaging of small molecules and proteins in tissues. Current Opinion in Chemical Biology. 2007;11:1. - PubMed
-
- Caldwell RL, Caprioloi RM. Tissue profiling by mass spectrometry: a review of methodology and applications. Molecular and Cellular Proteomics. 2005;4:394. - PubMed
-
- Chaurand P, Schwartz SA, Reyzer ML, Caprioli RM. Imaging mass spectrometry: principles and potentials. Toxicologic Pathology. 2005;33:92. - PubMed
-
- Chaurand P, Norris JL, Cornett DS, Mobley JA, Caprioli RM. New developments in profiling and imaging of proteins from tissue sections by MALDI mass spectrometry. Journal of Proteome Research. 2006;5:2889. - PubMed
-
- Groseclose MR, Andersson M, Hardesty WM, Caprioli RM. Identification of proteins directly from tissue: in situ tryptic digestions coupled with imaging mass spectrometry. Journal of Mass Spectrometry. 2007;42:254. - PubMed
Publication types
MeSH terms
Substances
Grants and funding
LinkOut - more resources
Full Text Sources
Other Literature Sources
