. 2007 Aug;5(8):e192.
doi: 10.1371/journal.pbio.0050192.

Myc dynamically and preferentially relocates to a transcription factory occupied by Igh

Affiliations

Myc dynamically and preferentially relocates to a transcription factory occupied by Igh

Cameron S Osborne et al. PLoS Biol. 2007 Aug.

Abstract

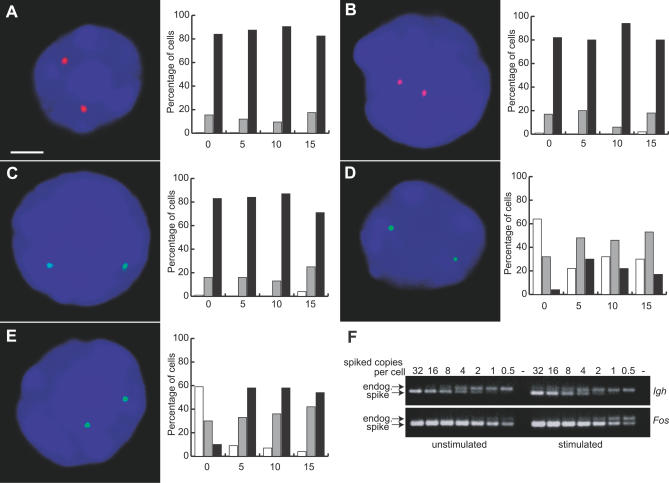
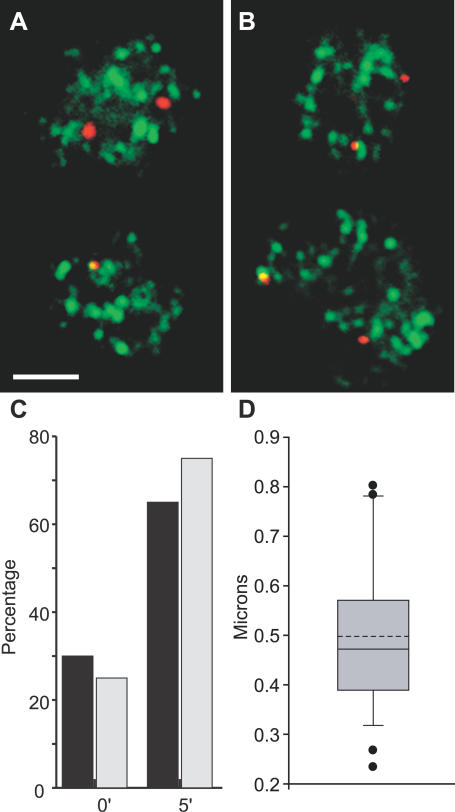
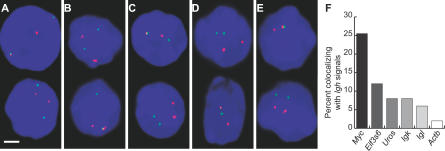
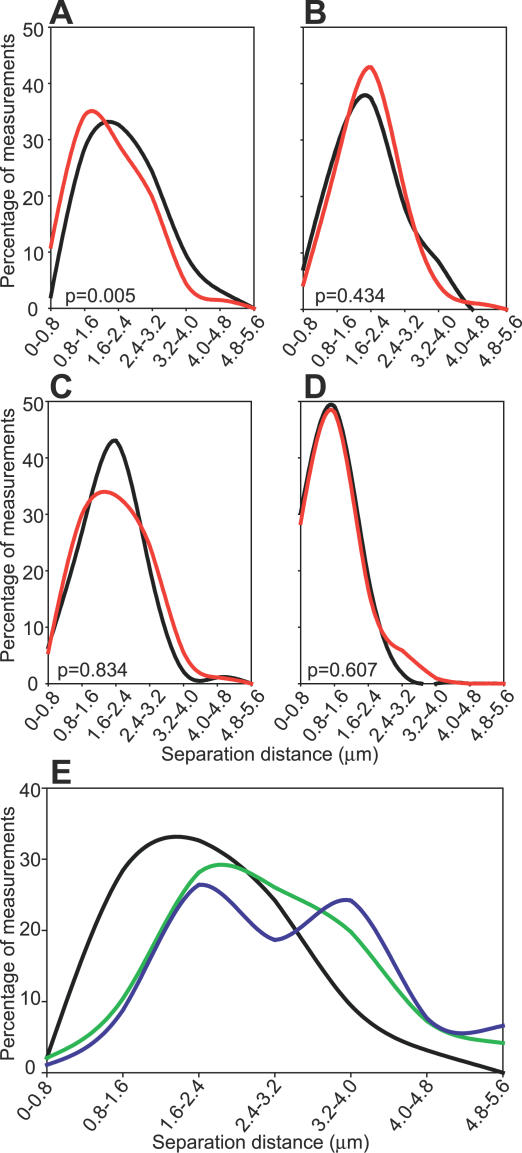
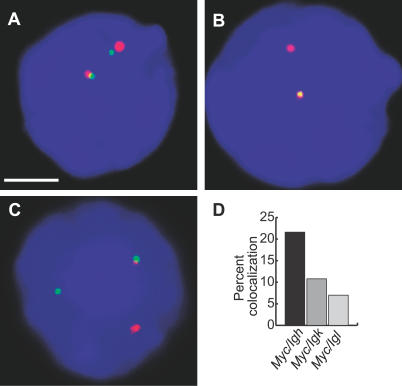
Transcription in mammalian nuclei is highly compartmentalized in RNA polymerase II-enriched nuclear foci known as transcription factories. Genes in cis and trans can share the same factory, suggesting that genes migrate to preassembled transcription sites. We used fluorescent in situ hybridization to investigate the dynamics of gene association with transcription factories during immediate early (IE) gene induction in mouse B lymphocytes. Here, we show that induction involves rapid gene relocation to transcription factories. Importantly, we find that the Myc proto-oncogene on Chromosome 15 is preferentially recruited to the same transcription factory as the highly transcribed Igh gene located on Chromosome 12. Myc and Igh are the most frequent translocation partners in plasmacytoma and Burkitt lymphoma. Our results show that transcriptional activation of IE genes involves rapid relocation to preassembled transcription factories. Furthermore, the data imply a direct link between the nonrandom interchromosomal organization of transcribed genes at transcription factories and the incidence of specific chromosomal translocations.


Conflict of interest statement

Competing interests. The authors have declared that no competing interests exist.

Figures

Figure 1
Figure 1. RNA FISH and Transcription Analysis in Unstimulated and Stimulated B Cells
RNA FISH in splenic B cells for Igh (red) (A), Igk (red) (B), Igl (green) (C), Fos (green) (D), and Myc (green) (E) gene transcription. DAPI staining is blue. Scale bar, 2 μm. We have shown nuclei in which both signals are in the same optical plane. The graphs show the percentage of cells with zero (white), one (grey), or two (black) transcription signals by RNA FISH in B cells, unstimulated and stimulated for the times indicated (in minutes). Results shown are from a single experiment, which was repeated three times, with similar results in every case. One hundred nuclei were assessed for each time point. The percentage of transcribing alleles was significantly different between unstimulated and stimulated cells for both Fos (0 min versus 5 min, p = 4.0 × 10⁻¹²; versus 10 min, p = 1.3 × 10⁻⁷; and versus 15 min, p = 6.3 × 10⁻⁷) and Myc (0 min versus 5 min, 3.9 × 10⁻²³; versus 10 min, 1.1 × 10⁻²²; and versus 15 min, 1.1 × 10⁻²²). (F) RT-PCR analysis with serial dilutions of spiked competitor to determine absolute nascent transcript numbers for Igh and Fos in unstimulated and stimulated B cells. The amount of competitor RNA spiked into each RNA extraction is shown above. The – lane is the no-DNA PCR control.
Figure 2
Figure 2. Transcription of Myc and Igh Occurs at Transcription Factories in B Cells
RNA immuno-FISH (RNA FISH combined with immunodetection of RNAP II) shows the positions of transcribing Myc (A) and Igh (B) alleles (red) relative to transcription factories (green). Shown are deconvoluted, single optical sections of stimulated B cells. We have presented cells in which both transcribing alleles are in the same focal plane. The Myc and Igh RNA FISH signals show 92% (n = 52) and 90% (n = 89) co-association with RNAP II foci, respectively. Scale bar, 2 μm.
Figure 3
Figure 3. Relocation of Myc Alleles to RNAP II Foci upon B Cell Activation
(A and B) DNA immuno-FISH of Myc locus (red) with RNAP II staining (green) in unstimulated (A) and stimulated (B) splenic B cells. Deconvoluted, single optical sections of the nuclei are shown. Scale bar, 2 μm. (C) Comparison of the percentage of Myc loci that overlap with an RNAP II focus by DNA immuno-FISH (black, n = 81 and n = 88 for unstimulated and stimulated, respectively), and the percentage of transcriptionally active Myc alleles by RNA FISH (gray) in unstimulated (0′) and 5 min–stimulated (5′) B cells. Comparison of DNA immuno-FISH results in unstimulated versus stimulated cells, p = 6.6 × 10⁻⁶. Comparison of RNA FISH results in unstimulated versus stimulated cells, p = 3.9 × 10⁻²³. Comparisons between DNA immuno-FISH and RNA FISH results in unstimulated and stimulated cells yielded p-values of 0.55 and 0.12, respectively. (D) Box and whiskers plot of the distribution of 3D measurements of the separation distance between non-RNAP II-associated Myc alleles and the nearest RNAP II focus by DNA immuno-FISH. Lower and upper whiskers denote the 10th and 90th percentiles, respectively, of the distribution. The lower and upper limits of the boxes indicate the 25th and 75th percentiles, respectively. Solid and dashed lines in the box denote the median and mean, respectively. Outliers are shown as filled circles.
Figure 4
Figure 4. Colocalization of IE Gene Transcription Signals with Igh
(A and B) Double-label RNA FISH in stimulated splenic B cells for Igh (red) and Fos (green) (A) or Igh (red) and Myc (green) (B). Scale bar, 2 μm. (C) The percentages of Igh signals with visibly overlapping (colocalizing) Fos or Myc signals, before and after B cell stimulation for the times indicated in minutes. One hundred nuclei were assessed for signals in each case. There are significantly more colocalizing signals in stimulated cells compared to unstimulated for Fos (0 min versus 5 min, p = 1.2 × 10⁻⁴; versus 10 min, p = 3.3 × 10⁻⁴; and versus 15 min, 1.4 × 10⁻³) and Myc (0 min versus 5 min, p = 2.5 × 10⁻³; versus 10 min, 4.2 × 10⁻³; and versus 15 min, p = 1.9 × 10⁻⁴). (D) A single optical section of a triple-label, RNA immuno-FISH on stimulated B cells showing Igh (red) and Myc (green) transcription, and RNAPII foci (blue). Images on right are enlargements of colocalized transcription signals associating with the same RNAPII focus. Scale bar, 2 μm.
Figure 5
Figure 5. Trans Colocalization of Transcriptionally Active Genes
Double-label RNA FISH in unstimulated B cells to detect Igh (red) and (A) Eif3s6 (green), (B) Uros (green), (C) Igk (green), (D) Igl (green), and (E) and Actb (green). DAPI staining is blue. Scale bar, 2 μm. (F) The percentage of Myc, Eif3s6, Uros, Igk, Igl, and Actb signals that overlap with an Igh signal. One hundred nuclei were assessed for each case except Uros, for which 70 nuclei were examined. Myc-Igh versus Eif3s6-Igh, p = 0.02; versus Uros-Igh, p = 0.01; versus Igk-Igh, p = 5.9 × 10⁻⁴; versus Igl-Igh, p = 5.2 × 10⁻⁵; and versus Actb-Igh, p = 1.0 × 10⁻⁶.
Figure 6
Figure 6. 3D DNA FISH Measurements of Separation Distances
(A–D) 3D DNA FISH separation distances between the Igh and the indicated alleles in unstimulated (black) and 5 min–stimulated (red) B cells. Values were grouped into 0.8 μm bins. Graphs show results for Myc-Igh (A), Uros-Igh (B), Actb-Igh (C), and Fos-Igh (D). At least 83 gene pairs were measured. p-Values show that Myc alleles are significantly shifted toward Igh upon stimulation. (E) Separation distance between Igh and Myc alleles in unstimulated B cells (black), kidney cells (green), and fetal liver erythroid cells (blue). p-Values for Myc and Igh separation distances for kidney and fetal liver versus unstimulated B cells are 3.3 × 10⁻⁵ and 6.2 × 10⁻⁹, respectively.
Figure 7
Figure 7. Co-Association Frequencies of Transcribing Myc Alleles with Immunoglobulin Genes
(A–C) Double-label RNA FISH in stimulated B cells (10 min), showing Myc transcription signals in green, and in red, Igh (A), Igk (B), and Igl (C). DAPI staining is blue. Scale bar, 2 μm. (D) The percentage of Myc signals that overlap with Igh, Igk, or Igl signals. One hundred nuclei were examined in each case. Myc-Igh versus Myc-Igk, p = 0.02; versus Myc-Igl, p = 0.0003.

References

    1. Cremer M, von Hase J, Volm T, Brero A, Kreth G, et al. Non-random radial higher-order chromatin arrangements in nuclei of diploid human cells. Chromosome Res. 2001;9:541–567. - PubMed
    1. Gerlich D, Beaudouin J, Kalbfuss B, Daigle N, Eils R, et al. Global chromosome positions are transmitted through mitosis in mammalian cells. Cell. 2003;112:751–764. - PubMed
    1. Parada LA, McQueen PG, Misteli T. Tissue-specific spatial organization of genomes. Genome Biol. 2004;5:R44. - PMC - PubMed
    1. Bolzer A, Kreth G, Solovei I, Koehler D, Saracoglu K, et al. Three-dimensional maps of all chromosomes in human male fibroblast nuclei and prometaphase rosettes. PLoS Biol. 2005;3:e157. doi: 10.1371/journal.pbio.0030157. - DOI - PMC - PubMed
    1. Branco MR, Pombo A. Intermingling of chromosome territories in interphase suggests role in translocations and transcription-dependent associations. PLoS Biol. 2006;4:e138. doi: 10.1371/journal.pbio.0040138. - DOI - PMC - PubMed

Publication types

MeSH terms

Substances