. 2007 Jul-Aug;13(7-8):362-70.
doi: 10.2119/2007–00049.Haase.

Differential gene expression after zinc supplementation and deprivation in human leukocyte subsets

Affiliations
Free PMC article

Differential gene expression after zinc supplementation and deprivation in human leukocyte subsets

Hajo Haase et al. Mol Med. 2007 Jul-Aug.
Free PMC article

Abstract

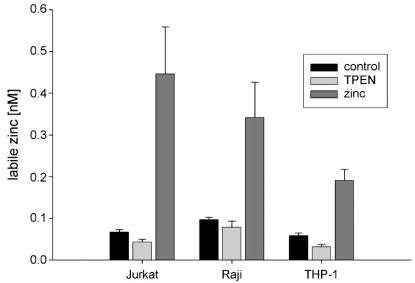
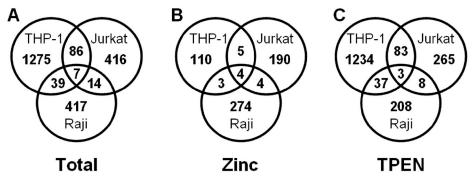
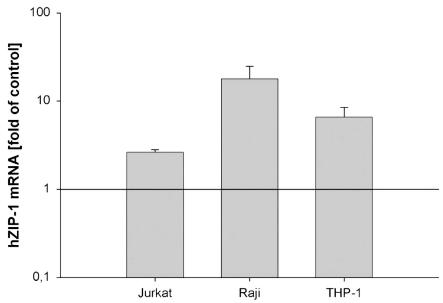
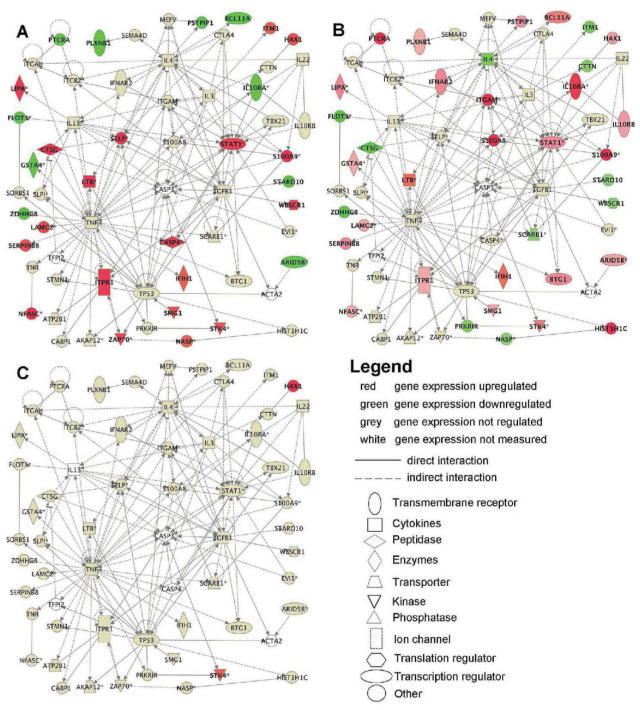
An individual's zinc status has a significant impact on the immune system, and zinc deficiency, as well as supplementation, modulates immune function. To investigate the effects of zinc on different leukocyte subsets, we used microarray technology to analyze and compare the changes in mRNA expression in cell culture models of monocytes (THP-1), T cells (Jurkat), and B cells (Raji), in response to supplementation for 40 h with 50 microM zinc or 2.5 microM of the membrane-permeant zinc chelator TPEN [N,N,N',N'-tetrakis-(2-pyridyl-methyl)ethylenediamine], respectively. In each cell type, several hundred genes were identified to be zinc sensitive, but only a total of seven genes were commonly regulated in all three cell lines. The majority of those genes were involved in zinc homeostasis, and none in immune function. Nevertheless, further analysis revealed that zinc affects entire functional networks of genes that are related to proinflammatory cytokines and cellular survival. Although the zinc-regulated activities are similar throughout the gene networks, the specific genes that are affected vary significantly between different cell types, a situation that helps to elucidate the disparity of the effects that zinc has on different leukocyte populations.


Figures

Figure 1
Figure 1
Intracellular labile zinc following incubation with zinc or TPEN. Cells were cultured in the presence of 50 μM ZnSO4 or 2.5 μM TPEN for 40 h. For the last 30 min, cells were loaded with the zinc-specific fluorescent dye FluoZin-3, and the resulting zinc-specific fluorescence was measured by flow cytometry and transformed into labile zinc concentrations as described in the methods section. Data shown are means from n = 4 independent experiments ± SE.
Figure 2
Figure 2
Commonly regulated genes. The datasets of genes whose expressions were changed > 1.5 fold in at least one cell line were compared between THP-1, Raji, and Jurkat. Displayed are the numbers of genes that are regulated in one cell line alone, or in two or all three cell lines by zinc and/or TPEN (A), or zinc alone (B), or TPEN alone (C).
Figure 3
Figure 3
Quantitative hZIP-1 PCR. The expression of the zinc import protein hZIP-1 mRNA after 40 h incubation with 2.5 μM TPEN was measured by quantitative PCR. Data shown are expression values relative to untreated control cells presented as means from n = 3 (Jurkat), n = 6 (Raji), or n = 7 (THP-1) independent experiments ± SE.
Figure 4
Figure 4
Functional networks of genes regulated by TPEN in THP-1 and Jurkat cells. The 86 genes whose expression was significantly altered by TPEN treatment in both THP-1 and Jurkat were analyzed with Ingenuity pathway analysis. Two networks with high significance were identified and merged. The resulting network is displayed, and the regulation of the genes is shown for Jurkat (A), THP-1 (B), and Raji (C). A network is a graphical representation of the molecular relationships between genes and gene products. Genes or gene products are represented as nodes, and the biological relationship between two nodes is represented as an edge (line). All edges are supported by at least one reference from the literature, from a textbook, or from canonical information stored in the Ingenuity Pathways Knowledge Base. The intensity of the node color indicates the degree of up- (red) or down- (green) regulation. Nodes are displayed using various shapes that represent the functional class of the gene product as indicated in the figure legend.
Figure 5
Figure 5
Functional networks of genes regulated by TPEN in THP-1 and Raji cells. The 40 genes whose expression was significantly altered by TPEN treatment in both THP-1 and Raji were analyzed with Ingenuity pathway analysis. The resulting network is displayed, and the regulation of the genes is shown for Raji (A), THP-1 (B), and Jurkat (C). For an explanation of the networks see Figure 4.

References

    1. Beyersmann D, Haase H. Function of zinc in signaling, proliferation and differentiation of mammalian cells. Biometals. 2001;14:331–41. - PubMed
    1. Cousins RJ, Blanchard RK, Popp MP, Liu L, Cao J, Moore JB, Green CL. A global view of the selectivity of zinc deprivation and excess on genes expressed in human THP-1 mononuclear cells. Proc Natl Acad Sci U S A. 2003;100:6952–7. - PMC - PubMed
    1. Daniel H, tom Dieck H. Nutrient-gene interactions: a single nutrient and hundreds of target genes. Biol Chem. 2004;385:571–83. - PubMed
    1. Beck FW, Li Y, Bao B, Prasad AS, Sarkar FH. Evidence for reprogramming global gene expression during zinc deficiency in the HUT-78 cell line. Nutrition. 2006;22:1045–56. - PubMed
    1. Wellinghausen N, Kirchner H, Rink L. The immunobiology of zinc. Immunol Today. 1997;18:519–21. - PubMed

Publication types

LinkOut - more resources