

Transcription factors in muscle atrophy caused by blocked neuromuscular transmission and muscle unloading in rats
- PMID: 17622304
- PMCID: PMC2014727
- DOI: 10.2119/2006-00066.Nordquist
Transcription factors in muscle atrophy caused by blocked neuromuscular transmission and muscle unloading in rats
Abstract
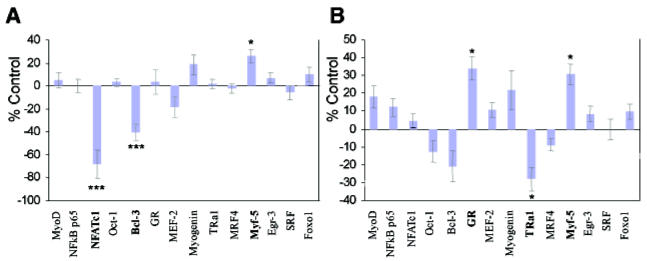
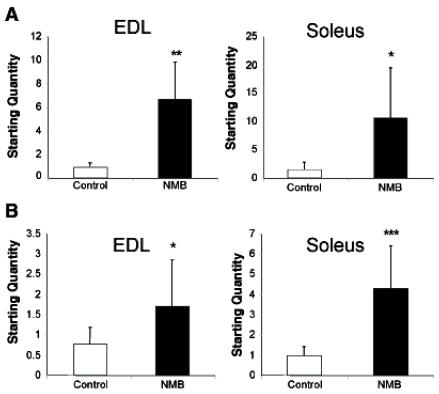
The muscle wasting associated with long-term intensive care unit (ICU) treatment has a negative effect on muscle function resulting in prolonged periods of rehabilitation and a decreased quality of life. To identify mechanisms behind this form of muscle wasting, we have used a rat model designed to mimic the conditions in an ICU. Rats were pharmacologically paralyzed with a postsynaptic blocker of neuromuscular transmission, and mechanically ventilated for one to two weeks, thereby unloading the limb muscles. Transcription factors were analyzed for cellular localization and nuclear concentration in the fast-twitch muscle extensor digitorum longus (EDL) and in the slow-twitch soleus. Significant muscle wasting and upregulation of mRNA for the ubiquitin ligases MAFbx and MuRF1 followed the treatment. The IkappaB family-member Bcl-3 displayed a concomitant decrease in concentration, suggesting altered kappaB controlled gene expression, although NFkappaB p65 was not significantly affected. The nuclear levels of the glucocorticoid receptor (GR) and the thyroid receptor alpha1 (TRalpha1) were altered and also suggested as potential mediators of the MAFbx- and MuRF1-induction in the absence of induced Foxo1. We believe that this model, and the strategy of quantifying nuclear proteins, will provide a valuable tool for further, more detailed, analyses of the muscle wasting occurring in patients kept on a mechanical ventilator.
Figures
Similar articles
-
Differential gene expression of muscle-specific ubiquitin ligase MAFbx/Atrogin-1 and MuRF1 in response to immobilization-induced atrophy of slow-twitch and fast-twitch muscles.J Physiol Sci. 2011 Nov;61(6):537-46. doi: 10.1007/s12576-011-0175-6. Epub 2011 Sep 8. J Physiol Sci. 2011. PMID: 21901639 Free PMC article.
-
Dystrophin involved in the susceptibility of slow muscles to hindlimb unloading via concomitant activation of TGF-β1/Smad3 signaling and ubiquitin-proteasome degradation in mice.Cell Biochem Biophys. 2014 Nov;70(2):1057-67. doi: 10.1007/s12013-014-0023-4. Cell Biochem Biophys. 2014. PMID: 24839113
-
Suppression of atrogin-1 and MuRF1 prevents dexamethasone-induced atrophy of cultured myotubes.Metabolism. 2013 Oct;62(10):1495-502. doi: 10.1016/j.metabol.2013.05.018. Epub 2013 Jul 15. Metabolism. 2013. PMID: 23866982
-
Skeletal muscle hypertrophy and atrophy signaling pathways.Int J Biochem Cell Biol. 2005 Oct;37(10):1974-84. doi: 10.1016/j.biocel.2005.04.018. Int J Biochem Cell Biol. 2005. PMID: 16087388 Review.
-
Mechanisms for fiber-type specificity of skeletal muscle atrophy.Curr Opin Clin Nutr Metab Care. 2013 May;16(3):243-50. doi: 10.1097/MCO.0b013e328360272d. Curr Opin Clin Nutr Metab Care. 2013. PMID: 23493017 Free PMC article. Review.
Cited by
-
Skeletal muscle atrophy: disease-induced mechanisms may mask disuse atrophy.J Muscle Res Cell Motil. 2015 Dec;36(6):405-21. doi: 10.1007/s10974-015-9439-8. Epub 2016 Jan 4. J Muscle Res Cell Motil. 2015. PMID: 26728748 Review.
-
Myofibrillar protein and gene expression in acute quadriplegic myopathy.J Neurol Sci. 2009 Oct 15;285(1-2):28-38. doi: 10.1016/j.jns.2009.04.041. Epub 2009 Jun 6. J Neurol Sci. 2009. PMID: 19501843 Free PMC article.
-
The Sick and the Weak: Neuropathies/Myopathies in the Critically Ill.Physiol Rev. 2015 Jul;95(3):1025-109. doi: 10.1152/physrev.00028.2014. Physiol Rev. 2015. PMID: 26133937 Free PMC article. Review.
-
Vamorolone treatment improves skeletal muscle outcome in a critical illness myopathy rat model.Acta Physiol (Oxf). 2019 Feb;225(2):e13172. doi: 10.1111/apha.13172. Epub 2018 Sep 6. Acta Physiol (Oxf). 2019. PMID: 30120816 Free PMC article.
-
Masseter muscle myofibrillar protein synthesis and degradation in an experimental critical illness myopathy model.PLoS One. 2014 Apr 4;9(4):e92622. doi: 10.1371/journal.pone.0092622. eCollection 2014. PLoS One. 2014. PMID: 24705179 Free PMC article.
References
-
- McKinnell IW, Rudnicki MA. Molecular mechanisms of muscle atrophy. Cell. 2004;119:907–10. - PubMed
-
- Orzechowski A, Grizard J, Jank M, Gajkowska B, Lokociejewska M, Zaron-Teperek M, Godlewski M. Dexamethasone-mediated regulation of death and differentiation of muscle cells: Is hydrogen peroxide involved in the process? Reprod Nutr Dev. 2002;42:197–216. - PubMed
-
- Cai D, Frantz JD, Tawa NE, et al. IKKbeta/NF-kappaB activation causes severe muscle wasting in mice. Cell. 2004;119:285–98. - PubMed
-
- Gomes-Marcondes MC, Tisdale MJ. Induction of protein catabolism and the ubiquitin-proteasome pathway by mild oxidative stress. Cancer Lett. 2002;180:69–74. - PubMed
Publication types
MeSH terms
Substances
Grants and funding
LinkOut - more resources
Full Text Sources
Molecular Biology Databases
Research Materials
Miscellaneous