. 2007 Jul 10:8:226.
doi: 10.1186/1471-2164-8-226.

Cloning and expression of a zebrafish SCN1B ortholog and identification of a species-specific splice variant

Affiliations

Cloning and expression of a zebrafish SCN1B ortholog and identification of a species-specific splice variant

Amanda J Fein et al. BMC Genomics. .

Abstract

Background: Voltage-gated Na+ channel beta1 (Scn1b) subunits are multi-functional proteins that play roles in current modulation, channel cell surface expression, cell adhesion, cell migration, and neurite outgrowth. We have shown previously that beta1 modulates electrical excitability in vivo using a mouse model. Scn1b null mice exhibit spontaneous seizures and ataxia, slowed action potential conduction, decreased numbers of nodes of Ranvier in myelinated axons, alterations in nodal architecture, and differences in Na+ channel alpha subunit localization. The early death of these mice at postnatal day 19, however, make them a challenging model system to study. As a first step toward development of an alternative model to investigate the physiological roles of beta1 subunits in vivo we cloned two beta1-like subunit cDNAs from D. rerio.

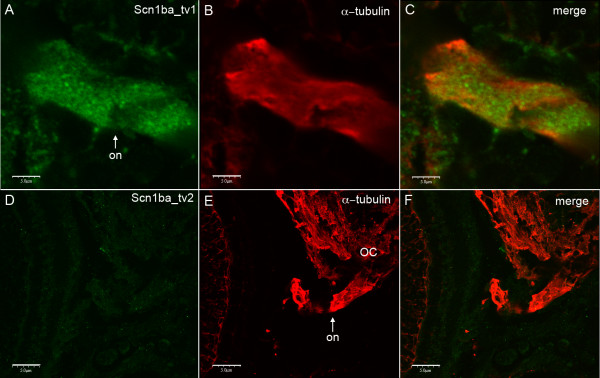
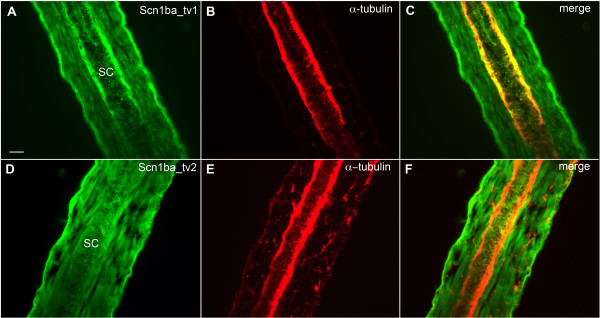
Results: Two beta1-like subunit mRNAs from zebrafish, scn1ba_tv1 and scn1ba_tv2, arise from alternative splicing of scn1ba. The deduced amino acid sequences of Scn1ba_tv1 and Scn1ba_tv2 are identical except for their C-terminal domains. The C-terminus of Scn1ba_tv1 contains a tyrosine residue similar to that found to be critical for ankyrin association and Na+ channel modulation in mammalian beta1. In contrast, Scn1ba_tv2 contains a unique, species-specific C-terminal domain that does not contain a tyrosine. Immunohistochemical analysis shows that, while the expression patterns of Scn1ba_tv1 and Scn1ba_tv2 overlap in some areas of the brain, retina, spinal cord, and skeletal muscle, only Scn1ba_tv1 is expressed in optic nerve where its staining pattern suggests nodal expression. Both scn1ba splice forms modulate Na+ currents expressed by zebrafish scn8aa, resulting in shifts in channel gating mode, increased current amplitude, negative shifts in the voltage dependence of current activation and inactivation, and increases in the rate of recovery from inactivation, similar to the function of mammalian beta1 subunits. In contrast to mammalian beta1, however, neither zebrafish subunit produces a complete shift to the fast gating mode and neither subunit produces complete channel inactivation or recovery from inactivation.

Conclusion: These data add to our understanding of structure-function relationships in Na+ channel beta1 subunits and establish zebrafish as an ideal system in which to determine the contribution of scn1ba to electrical excitability in vivo.


Figures

Figure 1
Figure 1
Zebrafish scn1ba_tv1 and scn1ba_tv2 are splice variants. A. Upper panel: Comparison of Scn1ba_tv1, Scn1ba_tv2 and Scn1b amino acid sequences. Amino acid residues that are identical are indicted in red, strongly similar substitutions are indicated by (:), and weakly similar amino acids are indicated by (.). Identical resides in exon 5 of Scn1ba_tv1 and Scn1b are indicated in green. The two cysteine residues predicted to form the Ig loop are indicated in blue. The conserved regions that form the A/A' face of the Ig loop, sites of interaction with theα subunit [17], are underlined. Tyrosine-181 in Scn1b and the corresponding residues in Scn1ba_tv1 and Scn1ba_tv2 are highlighted in yellow. Predicted sites of N-linked glycosylation are indicated by ▼. These sites were determined using NetNGlyc 1.0 [61]. Transmembrane segments are indicated as boxes. Peptides used for antibody generation are underlined in blue. Predicted β-sheets in the Ig loop domain, based on the crystal structure of myelin P0 [62], are shown with labeled arrows and correspond to the ribbon diagram included in the lower panel. Lower panel: Proposed three-dimensional structure of the Ig domain of β1 using the crystal structure of myelin Po (PDB 1NEU) as a template. The figure was created with the KiNG Viewer program via the RCSB Protein Data Bank web site [63]. β strands corresponding to the arrows in the upper panel are labeled A through G. B. Schematic showing the genomic organization of zebrafish scn1ba. The positions of introns 1 through 5 (I1 – I5) are indicated. Positions of primers used for RT-PCR in panel D are indicated. The C-terminal alternate splice domains contained in scn1ba_tv1 and scn1ba_tv2 are encoded by exon 5. C. Model of alternative splicing of scn1ba. Exons 4 and 5 (boxes) and intron 4 (line) are illustrated. The splice acceptor sequence at the beginning of exon 5 is indicated by formula image and the internal alternate splice acceptor site in exon 5 is indicated by a dashed line and by ▼. The location of stop codons in the resulting mRNAs are indicated. Drawings are not to scale. Consensus splice acceptor sequence [22] and the acceptor sequences found in exon 5 are indicated in the lower portion of the panel. Py: pyrimidine. Pu: purine. Lower case: intronic sequence. Upper case: exonic sequence. The "T" indicated by the red arrow in the internal, alternate acceptor is rare and significantly weakens the site [22]. D. RT-PCR from whole fish RNA demonstrating that both splice variants of scn1ba are expressed in the mRNA pool. The upper band corresponds to scn1ba_tv1 and the lower band corresponds to scn1ba_tv2. Translations of the resulting alternate C-terminal splice products are shown below. The sequence highlighted in green is found in Scn1ba_tv1 and corresponds to the green portion of exon 5 illustrated in panel C. The sequence highlighted in turquoise is found in Scn1ba_tv2 and corresponds to the turquoise portion of exon 5 illustrated in panel C.
Figure 2
Figure 2
In situ hybridization. A – D: Fish stained at 24 hpf. A. Staining is apparent in the olfactory placode (OP) and the midbrain (Mb). B. Dorsal mount showing staining in the trigeminal neuron (Tg) and in the rhombomeres of the hindbrain (Hb). C. Staining in spinal cord and skeletal muscle (sm). D. Higher magnification of Rohon Beard cells (RB) flanking skeletal muscle (sm). E. Fish at 48 hpf with staining in the Rohan Beard cells of the spinal cord (SC) and in the skeletal muscle. F. Staining throughout the brain, at the olfactory pits (OP), in the layers of the retina, and in the trigeminal ganglion (Tg) of fish at 72 hpf.
Figure 3
Figure 3
Antibody characterization. A. Left panel: Western blot probed with anti-Scn1ba_tv1. Lane 1: mock transfected Chinese hamster lung 1610 cells; Lane 2: Chinese hamster lung 1610 cells transiently transfected with scn1ba_tv2 cDNA; Lane 3: Chinese hamster lung 1610 cells transiently transfected with scn1ba_tv1 cDNA; Lane 4: 5 μg rat brain membranes. Arrows indicate immunoreactive bands at ~30 kD in the transfected cells and at ~30 kD and ~38 kD in rat brain. Right panel: Western blot probed with anti-Scn1ba_tv1. Lane 1: 5 μg rat brain membranes; Lane 2: 15 μg zebrafish brain membranes; Lane 3: 5 μg rat brain membranes probed with anti-Scn1ba_tv1 that had been preadsorbed to the immunizing peptide ("pre"); Lane 4: 15 μg zebrafish (zf) brain membranes probed with anti-Scn1ba_tv1 that had been preadsorbed to the immunizing peptide. Arrows indicate immunoreactive bands at ~30 kD and ~38 kD in both species. B. Left panel: Western blot probed with anti-Scn1ba_tv2. Lane 1: mock transfected Chinese hamster lung 1610 cells; Lane 2: Chinese hamster lung 1610 cells transiently transfected with scn1ba_tv2 cDNA; Lane 3: Chinese hamster lung 1610 cells transiently transfected with scn1ba_tv1; Lane 4: 5 μg rat brain membranes. Arrow indicates immunoreactive band at ~30 kD. Right panel: Western blot probed with anti-Scn1ba_tv2. Lane 1: 15 μg zebrafish brain membranes; Lane 2: 15 μg zebrafish brain membranes probed with anti-Scn1ba_tv2 that had been preadsorbed to the immunizing peptide ("pre"). Arrow shows immunoreactive band at ~38 kD.
Figure 4
Figure 4
Zebrafish Scn1ba_tv1 and Scn1ba_tv2 expression in early sensory systems. Panels A – C: anti-Scn1ba_tv1. Panels D – F: anti-Scn1ba_tv2. A. 48 hpf fish showing staining in the olfactory pit (OP) and in neuromasts of the anterior (ALL) and posterior (PLL) lateral line systems. B. Higher magnification of head region from panel A showing the anterior lateral line (ALL). C. 3 dpf fish showing staining in the posterior lateral line (PLL) of the trunk. D. 48 hpf fish showing staining in olfactory pit (OP) and anterior lateral line (ALL). E. 3 dpf fish showing staining of a neuromast in the posterior lateral line (PLL). F. 3 dpf fish showing staining in multiple neuromasts in the trunk corresponding to the posterior lateral line (PLL) system. Scale bar: 50 μm.
Figure 5
Figure 5
Zebrafish anti-Scn1ba_tv1 and anti-Scn1ba_tv2 stain olfactory pits. A – C: anti-Scn1ba_tv1 (green), anti-acetylated α-tubulin (red). D – F: anti-Scn1ba_tv2 (green), anti-acetylated α-tubulin (red). OP: olfactory pit. Scale bar: 50 μm.
Figure 6
Figure 6
Zebrafish Scn1ba_tv1 and Scn1ba_tv2 are expressed in brain. A – C. Anti-Scn1ba_tv2 (green), anti-acetylated α-tubulin (red). Arrow: optic nerve. Arrowhead: optic chiasm. Anti-Scn1ba_tv2 does not stain the optic nerve or optic chiasm. Scale bar: 20 μm. D – F. Anti-Scn1ba_tv1 (green), anti-acetylated α-tubulin (red). Scn1ba_tv1 staining appears in the optic tectum (TeO), post optic commissure (poc), and optic nerve (arrow). G – I. Anti-Scn1ba_tv1 (green), anti-acetylated α-tubulin (red). Scn1ba_tv1 staining appears in the poc and TeO as well as in the rostral hypothalamus (Hr), but is absent in the subcommisural organ (SCO).
Figure 7
Figure 7
Retinal patterning of Scn1ba_tv1 and Scn1ba_tv2. A – F: anti-Scn1ba_tv2 (green), anti-acetylated α-tubulin (red). G – L: anti-Scn1ba_tv1 (green), anti-acetylated α-tubulin (red). Anti-Scn1ba_tv2 stains the layers of the retina, including the ganglion cell layer (GCL), inner plexiform layer (IPL), outer plexiform layer (OPL), outer limiting membrane (OLM), and photoreceptor cell layer (PR). Staining appears to be absent in the inner nuclear layer (INL) and in the optic nerve (on). Anti-Scn1ba_tv1 stains all the layers of the retina including the inner nuclear layer, where it shows robust staining. In contrast to anti-Scn1ba_tv2, anti-Scn1ba_tv1 labels optic nerve. Scale bar: 50 μm.
Figure 8
Figure 8
Zebrafish Scn1ba_tv1 but not Scn1ba_tv2 is expressed in optic nerve. Sections generated from 13 dpf zebrafish were stained with anti-Scn1ba_tv1 or anti-Scn1ba_tv2 and anti-acetylated α-tubulin. A – C: Anti Scn1ba_tv1 (green), anti-acetylated α-tubulin (red). D – F: Anti-Scn1ba_tv2 (green), anti-acetylated α-tubulin (red). Images were viewed with an Olympus FluoView 500 confocal microscope at 100× magnification with 5× additional zoom. Scale bar: 50 μm.
Figure 9
Figure 9
Zebrafish Scn1ba_tv1 and Scn1ba_tv2 are differentially expressed in the spinal cord. A – C: Anti-Scn1ba_tv1 (green), anti-acetylated α-tubulin (red). D – F: Anti-Scn1ba_tv2 (green), anti-acetylated α-tubulin (red). SC: spinal cord. Scale bar: 50 μm.
Figure 10
Figure 10
Zebrafish Scn1ba_tv1 and Scn1ba_tv2 are expressed in skeletal muscle. A, B, D, E, F: Anti-Scn1ba_tv1 β1 (green), α-bungarotoxin (BTX) (red). C. Anti-Scn1ba_tv2 (green). Labeling with anti-Scn1ba_tv1 produced two different staining patterns; staining at the t-tubules of striated muscle (A, D, and G), and punctate staining along the longitudinal edge of the muscle cells (arrowheads in B). Staining with anti-Scn1ba_tv2 labeled the t-tubule system and did not appear to label to muscle surface. Anti-Scn1ba_tv1 staining did not colocalize with α-BTX (D – F and H – I), suggesting that Scn1ba_tv1 is not expressed at neuromuscular junctions (arrows). Scale bar: 10 μm.
Figure 11
Figure 11
Zebrafish β1 subunits modulate scn8aa. A. Normalized Current Traces. Effects of rat and zebrafish β subunits on current time course. Each trace shows the mean current elicited by depolarization to 0 mV from a holding potential of -80 mV in oocytes injected with the indicated combinations of α and β subunits. B. Current Density. Coexpression of scn1ba_tv1, scn1ba_tv2, or Scn1b cRNA with scn8aa cRNA results in increased current amplitude compared to α alone. Individual peak current amplitudes for each condition were measured and normalized to the mean current amplitude of scn8aa for each experiment to account for variability between different oocyte preparations. C. Representative Na+ current traces for scn8aa alone (upper left), scn8aa plus scn1ba_tv1 (upper right), scn8aa plus scn1ba_tv2 (lower left), and scn8aa plus Scn1b (lower right) D. Current-voltage relationships for the families of Na+ currents shown in panel C. E. Voltage dependence of activation. Coexpression of scn8aa with Scn1b (●), scn1ba_tv1 (△), or scn1ba_tv2 (▽) results in hyperpolarizing shifts in the voltage dependence of activation compared to the expression of scn8aa alone (■). Coexpression of scn8aa with scn1ba_tv1 results in a significantly greater hyperpolarizing shift than coexpression with scn1ba_tv2. F. Voltage dependence of inactivation. Coexpression of scn8aa with Scn1b, scn1ba_tv1, or scn1ba_tv2 resulted in hyperpolarizing shifts in the voltage dependence of inactivation compared to scna8a alone. The effects of scn1ba_tv1 and scn1ba_tv2 on the voltage-dependence of inactivation are indistinguishable from each other. G. Zebrafish β subunits speed recovery from inactivation. Coexpression of scn8aa with Scn1b (●), scn1ba_tv1 (△), or scn1ba_tv2 (▽) results in a dramatic increase in the rate of recovery from inactivation compared with scn8aa alone (■). Zebrafish scn8aa (■) expressed alone has a very slow rate of recovery, and a full recovery was never achieved during the duration of the experiment.

References

    1. Meadows LS, Isom LL. Sodium channels as macromolecular complexes: Implications for inherited arrhythmia syndromes. Cardiovasc Res. 2005;67:448–58. doi: 10.1016/j.cardiores.2005.04.003. - DOI - PubMed
    1. Isom LL. The role of sodium channels in cell adhesion. Front Biosci. 2002;7:12–23. doi: 10.2741/isom. - DOI - PubMed
    1. Isom LL, De Jongh KS, Patton DE, Reber BFX, Offord J, Charbonneau H, Walsh K, Goldin AL, Catterall WA. Primary structure and functional expression of the β1 subunit of the rat brain sodium channel. Science. 1992;256:839–842. doi: 10.1126/science.1375395. - DOI - PubMed
    1. Isom LL, Scheuer T, Brownstein AB, Ragsdale DS, Murphy BJ, Catterall WA. Functional co-expression of the β1 and type IIA α subunits of sodium channels in a mammalian cell line. J Biol Chem. 1995;270:3306–3312. doi: 10.1074/jbc.270.43.25696. - DOI - PubMed
    1. Xiao ZC, DS Ragsdale, Malhorta JD, Mattei LN, Braun PE, Schachner M, Isom LL. Tenascin-R is a functional modulator of sodium channel β subunits. J Biol Chem. 1999;274:26511–26517. doi: 10.1074/jbc.274.37.26511. - DOI - PubMed

Publication types

MeSH terms