

Reconstructing the ancestor of Mycobacterium leprae: the dynamics of gene loss and genome reduction
- PMID: 17623808
- PMCID: PMC1933519
- DOI: 10.1101/gr.6360207
Reconstructing the ancestor of Mycobacterium leprae: the dynamics of gene loss and genome reduction
Abstract
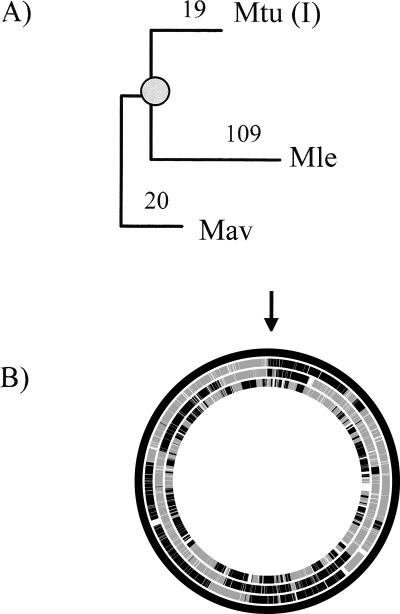
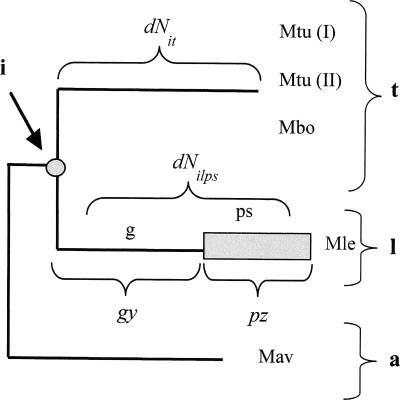
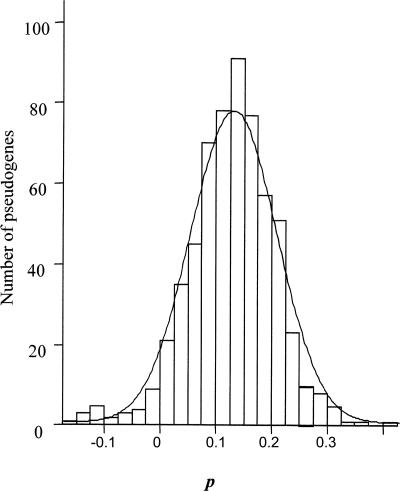
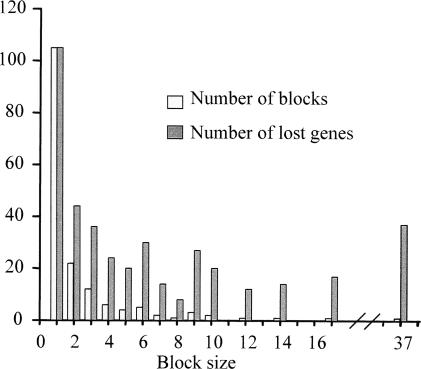
We have reconstructed the gene content and order of the last common ancestor of the human pathogens Mycobacterium leprae and Mycobacterium tuberculosis. During the reductive evolution of M. leprae, 1537 of 2977 ancestral genes were lost, among which we found 177 previously unnoticed pseudogenes. We find evidence that a massive gene inactivation took place very recently in the M. leprae lineage, leading to the loss of hundreds of ancestral genes. A large proportion of their nucleotide content ( approximately 89%) still remains in the genome, which allowed us to characterize and date them. The age of the pseudogenes was computed using a new methodology based on the rates and patterns of substitution in the pseudogenes and functional orthologous genes of closely related genomes. The position of the genes that were lost in the ancestor's genome revealed that the process of function loss and degradation mainly took place through a gene-to-gene inactivation process, followed by the gradual loss of their DNA. This suggests a scenario of massive genome reduction through many nearly simultaneous pseudogenization events, leading to a highly specialized pathogen.
Figures


Similar articles
-
Biological implications of Mycobacterium leprae gene expression during infection.J Mol Microbiol Biotechnol. 2004;8(1):58-72. doi: 10.1159/000082081. J Mol Microbiol Biotechnol. 2004. PMID: 15741741
-
Insight into the evolution and origin of leprosy bacilli from the genome sequence of Mycobacterium lepromatosis.Proc Natl Acad Sci U S A. 2015 Apr 7;112(14):4459-64. doi: 10.1073/pnas.1421504112. Epub 2015 Mar 23. Proc Natl Acad Sci U S A. 2015. PMID: 25831531 Free PMC article.
-
The decaying genome of Mycobacterium leprae.Lepr Rev. 2001 Dec;72(4):387-98. Lepr Rev. 2001. PMID: 11826475 Review.
-
Highly Reduced Genome of the New Species Mycobacterium uberis, the Causative Agent of Nodular Thelitis and Tuberculoid Scrotitis in Livestock and a Close Relative of the Leprosy Bacilli.mSphere. 2018 Oct 3;3(5):e00405-18. doi: 10.1128/mSphere.00405-18. mSphere. 2018. PMID: 30282756 Free PMC article.
-
Mycobacterium leprae's evolution and environmental adaptation.Acta Trop. 2019 Sep;197:105041. doi: 10.1016/j.actatropica.2019.105041. Epub 2019 May 30. Acta Trop. 2019. PMID: 31152726 Review.
Cited by
-
Defining mycobacteria: Shared and specific genome features for different lifestyles.Indian J Microbiol. 2009 Mar;49(1):11-47. doi: 10.1007/s12088-009-0006-0. Epub 2009 Feb 5. Indian J Microbiol. 2009. PMID: 23100749 Free PMC article.
-
ECOD domain classification of 48 whole proteomes from AlphaFold Structure Database using DPAM2.PLoS Comput Biol. 2024 Feb 28;20(2):e1011586. doi: 10.1371/journal.pcbi.1011586. eCollection 2024 Feb. PLoS Comput Biol. 2024. PMID: 38416793 Free PMC article.
-
Origin and fate of pseudogenes in Hemiascomycetes: a comparative analysis.BMC Genomics. 2010 Apr 22;11:260. doi: 10.1186/1471-2164-11-260. BMC Genomics. 2010. PMID: 20412590 Free PMC article.
-
Metabolic model-based analysis of the emergence of bacterial cross-feeding via extensive gene loss.BMC Syst Biol. 2018 Jun 15;12(1):69. doi: 10.1186/s12918-018-0588-4. BMC Syst Biol. 2018. PMID: 29907104 Free PMC article.
-
Common variants in the PARL and PINK1 genes increase the risk to leprosy in Han Chinese from South China.Sci Rep. 2016 Nov 23;6:37086. doi: 10.1038/srep37086. Sci Rep. 2016. PMID: 27876828 Free PMC article.
References
-
- Andersson S.G.E., Kurland C.G., Kurland C.G. Reductive evolution of resident genomes. Trends Microbiol. 1998;6:263–268. - PubMed
-
- Belda E., Moya A., Silva F.J., Moya A., Silva F.J., Silva F.J. Genome rearrangement distances and gene order phylogeny in gamma-proteobacteria. Mol. Biol. Evol. 2005;22:1456–1467. - PubMed
-
- Cole S.T., Brosch R., Parkhill J., Garnier T., Churcher C., Harris D., Gordon S.V., Eiglmeier K., Gas S., Barry C.E., Brosch R., Parkhill J., Garnier T., Churcher C., Harris D., Gordon S.V., Eiglmeier K., Gas S., Barry C.E., Parkhill J., Garnier T., Churcher C., Harris D., Gordon S.V., Eiglmeier K., Gas S., Barry C.E., Garnier T., Churcher C., Harris D., Gordon S.V., Eiglmeier K., Gas S., Barry C.E., Churcher C., Harris D., Gordon S.V., Eiglmeier K., Gas S., Barry C.E., Harris D., Gordon S.V., Eiglmeier K., Gas S., Barry C.E., Gordon S.V., Eiglmeier K., Gas S., Barry C.E., Eiglmeier K., Gas S., Barry C.E., Gas S., Barry C.E., Barry C.E., et al. Deciphering the biology of Mycobacterium tuberculosis from the complete genome sequence. Nature. 1998;393:537–544. - PubMed
Publication types
MeSH terms
Substances
LinkOut - more resources
Full Text Sources