

Temporal and spatial transcriptional profiles of aging in Drosophila melanogaster
- PMID: 17623811
- PMCID: PMC1933522
- DOI: 10.1101/gr.6216607
Temporal and spatial transcriptional profiles of aging in Drosophila melanogaster
Abstract
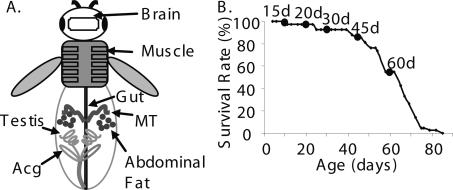
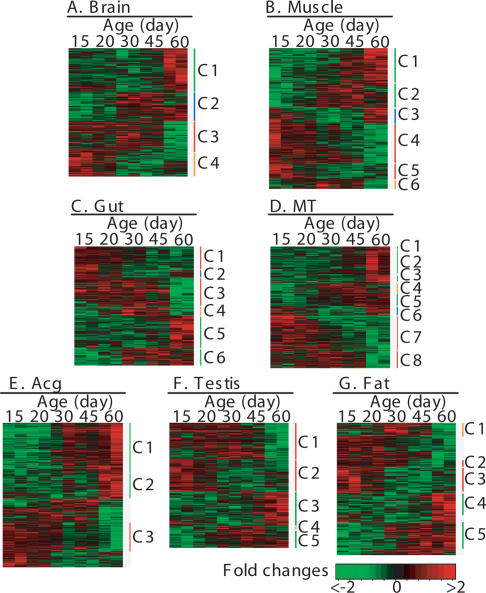
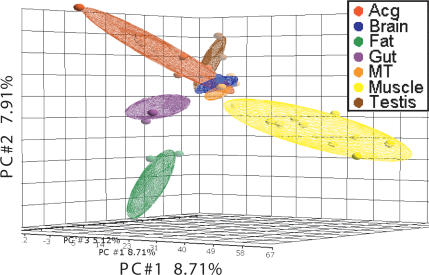
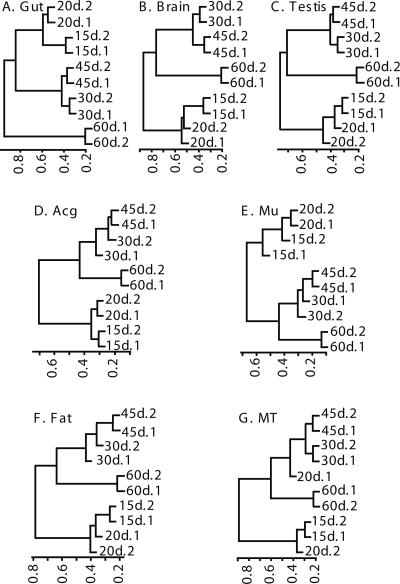
Temporal and tissue-specific alterations in gene expression have profound effects on aging of multicellular organisms. However, much remains unknown about the patterns of molecular changes in different tissues and how different tissues interact with each other during aging. Previous genomic studies on invertebrate aging mostly utilized the whole body or body parts and limited age-points, and failed to address tissue-specific aging. Here we measured genome-wide expression profiles of aging in Drosophila melanogaster for seven tissues representing nervous, muscular, digestive, renal, reproductive, and storage systems at six adult ages. In each tissue, we identified hundreds of age-related genes exhibiting significant changes of transcript levels with age. The age-related genes showed clear tissue-specific patterns: <10% of them in each tissue were in common with any other tissue; <20% of the biological processes enriched with the age-related genes were in common between any two tissues. A significant portion of the age-related genes were those involved in physiological functions regulated by the corresponding tissue. Nevertheless, we identified some overlaps of the age-related functional groups among tissues, suggesting certain common molecular mechanisms that regulate aging in different tissues. This study is one of the first that defined global, temporal, and spatial changes associated with aging from multiple tissues at multiple ages, showing that different tissues age in different patterns in an organism. The spatial and temporal transcriptome data presented in this study provide a basis and a valuable resource for further genetic and genomic investigation of tissue-specific regulation of aging.
Figures
Similar articles
-
Specific age-related signatures in Drosophila body parts transcriptome.BMC Genomics. 2006 Apr 4;7:69. doi: 10.1186/1471-2164-7-69. BMC Genomics. 2006. PMID: 16584578 Free PMC article.
-
Genome-wide transcript profiles in aging and calorically restricted Drosophila melanogaster.Curr Biol. 2002 Apr 30;12(9):712-23. doi: 10.1016/s0960-9822(02)00808-4. Curr Biol. 2002. PMID: 12007414
-
Genetic knockdown of a single organic anion transporter alters the expression of functionally related genes in Malpighian tubules of Drosophila melanogaster.J Exp Biol. 2012 Aug 1;215(Pt 15):2601-10. doi: 10.1242/jeb.071100. J Exp Biol. 2012. PMID: 22786636
-
The white locus of Drosophila melanogaster.Results Probl Cell Differ. 1987;14:81-94. doi: 10.1007/978-3-540-47783-9_6. Results Probl Cell Differ. 1987. PMID: 3112880 Review. No abstract available.
-
Genetics of aging in the fruit fly, Drosophila melanogaster.Annu Rev Genet. 2003;37:329-48. doi: 10.1146/annurev.genet.37.040103.095211. Annu Rev Genet. 2003. PMID: 14616064 Review.
Cited by
-
Inhibition of S6K lowers age-related inflammation and increases lifespan through the endolysosomal system.Nat Aging. 2024 Apr;4(4):491-509. doi: 10.1038/s43587-024-00578-3. Epub 2024 Feb 27. Nat Aging. 2024. PMID: 38413780 Free PMC article.
-
Term-tissue specific models for prediction of gene ontology biological processes using transcriptional profiles of aging in drosophila melanogaster.BMC Bioinformatics. 2008 Feb 28;9:129. doi: 10.1186/1471-2105-9-129. BMC Bioinformatics. 2008. PMID: 18307794 Free PMC article.
-
What do we mean by "aging"? Questions and perspectives revealed by studies in Drosophila.Mech Ageing Dev. 2023 Jul;213:111839. doi: 10.1016/j.mad.2023.111839. Epub 2023 Jun 23. Mech Ageing Dev. 2023. PMID: 37354919 Free PMC article.
-
Sociogenomics of cooperation and conflict during colony founding in the fire ant Solenopsis invicta.PLoS Genet. 2013;9(8):e1003633. doi: 10.1371/journal.pgen.1003633. Epub 2013 Aug 8. PLoS Genet. 2013. PMID: 23950725 Free PMC article.
-
Studying the Geroprotective Properties of YAP/TAZ Signaling Inhibitors on Drosophila melanogaster Model.Int J Mol Sci. 2023 Mar 22;24(6):6006. doi: 10.3390/ijms24066006. Int J Mol Sci. 2023. PMID: 36983079 Free PMC article.
References
-
- Adams M.D., Celniker S.E., Holt R.A., Evans C.A., Gocayne J.D., Amanatides P.G., Scherer S.E., Li P.W., Hoskins R.A., Galle R.F., Celniker S.E., Holt R.A., Evans C.A., Gocayne J.D., Amanatides P.G., Scherer S.E., Li P.W., Hoskins R.A., Galle R.F., Holt R.A., Evans C.A., Gocayne J.D., Amanatides P.G., Scherer S.E., Li P.W., Hoskins R.A., Galle R.F., Evans C.A., Gocayne J.D., Amanatides P.G., Scherer S.E., Li P.W., Hoskins R.A., Galle R.F., Gocayne J.D., Amanatides P.G., Scherer S.E., Li P.W., Hoskins R.A., Galle R.F., Amanatides P.G., Scherer S.E., Li P.W., Hoskins R.A., Galle R.F., Scherer S.E., Li P.W., Hoskins R.A., Galle R.F., Li P.W., Hoskins R.A., Galle R.F., Hoskins R.A., Galle R.F., Galle R.F., et al. The genome sequence of Drosophila melanogaster. Science. 2000;287:2185–2195. - PubMed
-
- Ashburner M. Drosophila: A laboratory handbook. Cold Spring Harbor Laboratory Press; Cold Spring Harbor, NY: 1989.
-
- Ashburner M., Ball C.A., Blake J.A., Botstein D., Butler H., Cherry J.M., Davis A.P., Dolinski K., Dwight S.S., Eppig J.T., Ball C.A., Blake J.A., Botstein D., Butler H., Cherry J.M., Davis A.P., Dolinski K., Dwight S.S., Eppig J.T., Blake J.A., Botstein D., Butler H., Cherry J.M., Davis A.P., Dolinski K., Dwight S.S., Eppig J.T., Botstein D., Butler H., Cherry J.M., Davis A.P., Dolinski K., Dwight S.S., Eppig J.T., Butler H., Cherry J.M., Davis A.P., Dolinski K., Dwight S.S., Eppig J.T., Cherry J.M., Davis A.P., Dolinski K., Dwight S.S., Eppig J.T., Davis A.P., Dolinski K., Dwight S.S., Eppig J.T., Dolinski K., Dwight S.S., Eppig J.T., Dwight S.S., Eppig J.T., Eppig J.T., et al. Gene ontology: Tool for the unification of biology. The Gene Ontology Consortium. Nat. Genet. 2000;25:25–29. - PMC - PubMed
-
- Demerec M. Biology of Drosophila. Cold Spring Harbor Laboratory Press; Cold Spring Harbor, New York: 1994.
-
- Dillin A., Crawford D.K., Kenyon C., Crawford D.K., Kenyon C., Kenyon C. Timing requirements for insulin/IGF-1 signaling in C. elegans. Science. 2002;298:830–834. - PubMed
Publication types
MeSH terms
Substances
Grants and funding
LinkOut - more resources
Full Text Sources
Other Literature Sources
Medical
Molecular Biology Databases