

Functional consequences of methionine oxidation of hERG potassium channels
- PMID: 17624316
- PMCID: PMC3905454
- DOI: 10.1016/j.bcp.2007.06.002
Functional consequences of methionine oxidation of hERG potassium channels
Abstract
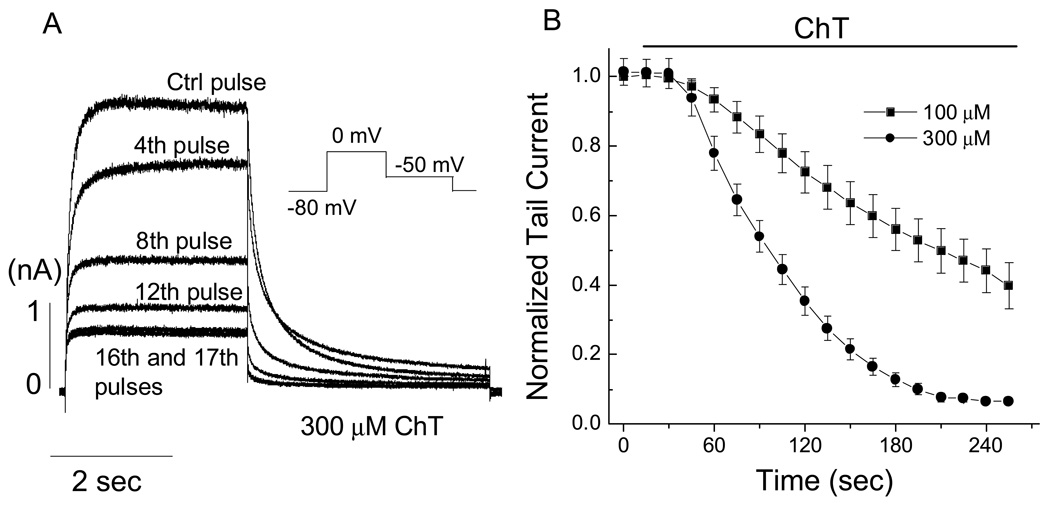
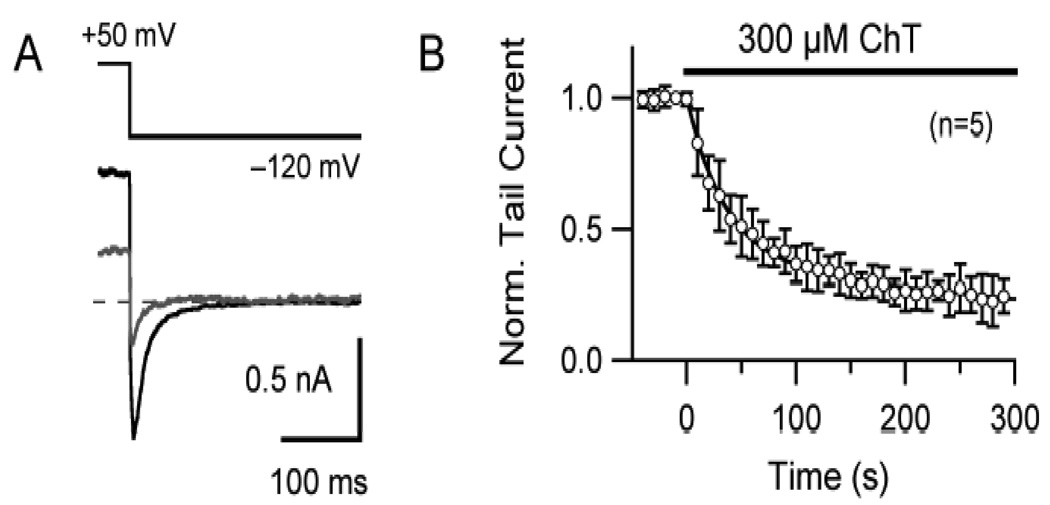
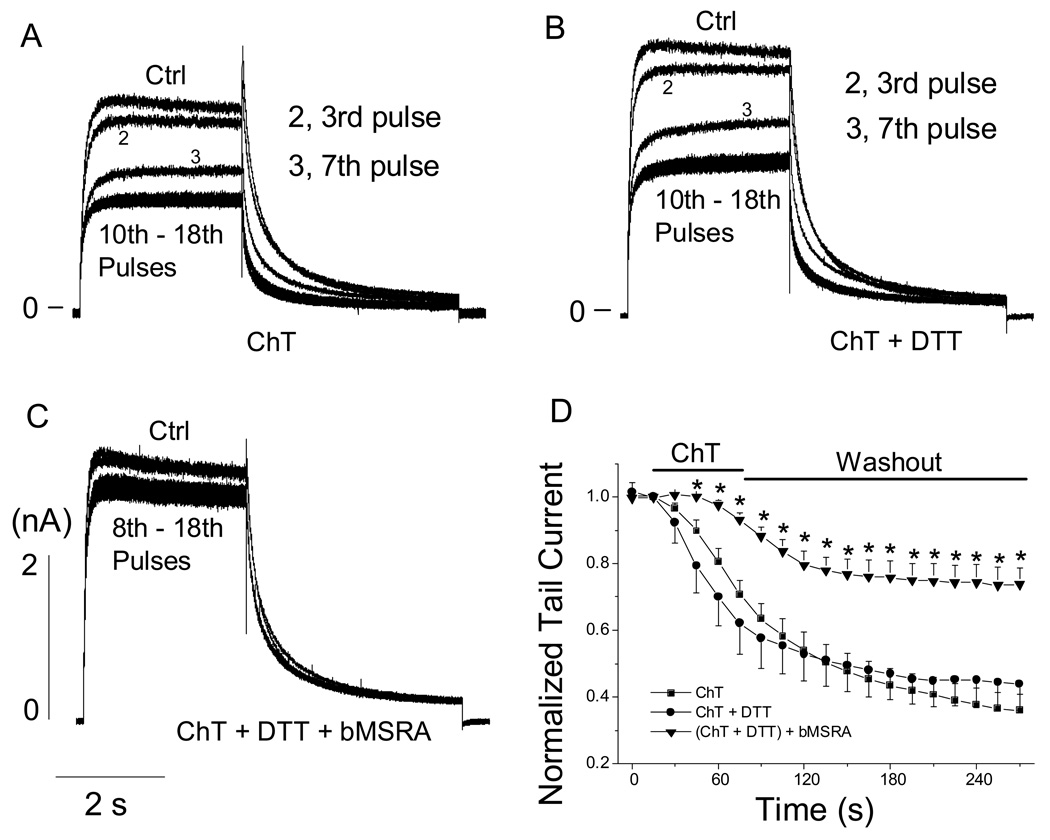
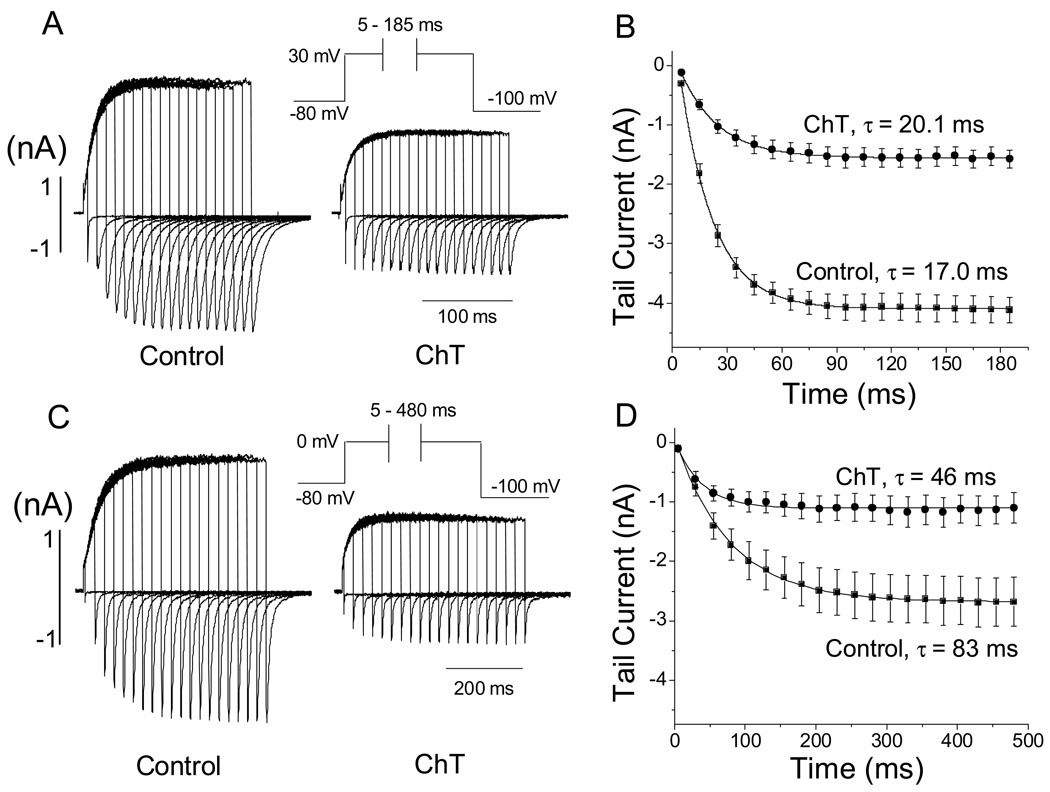
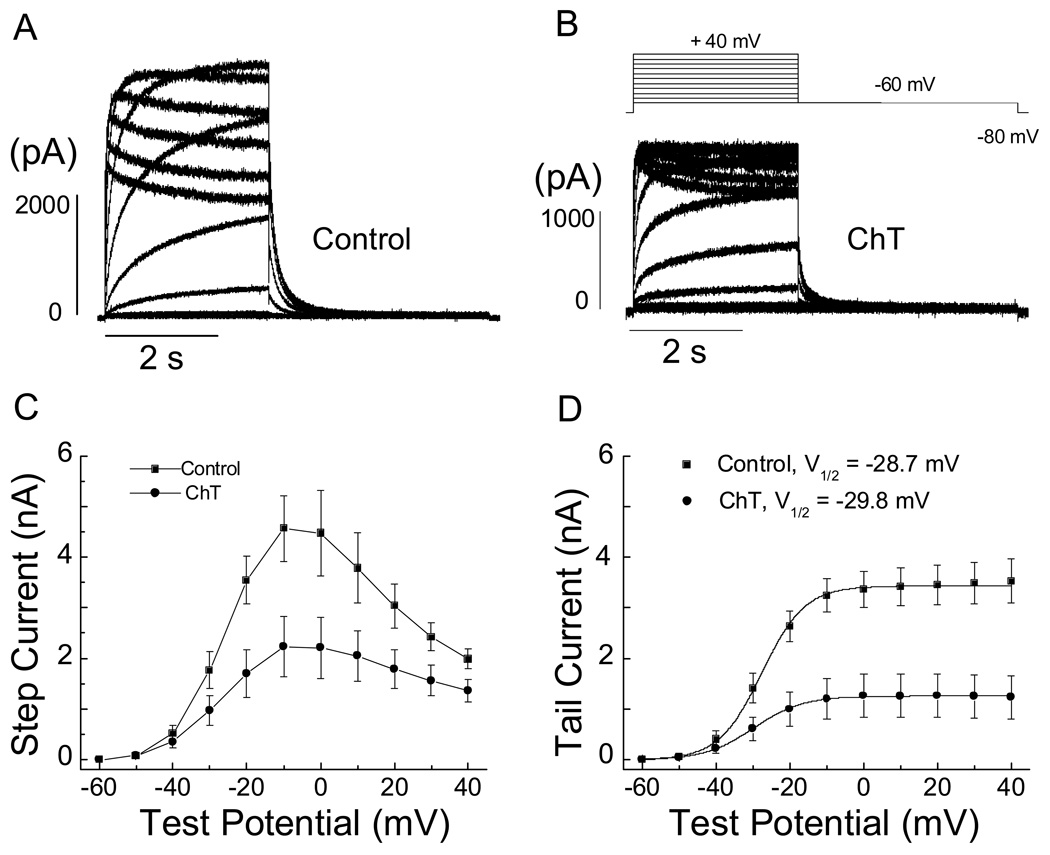
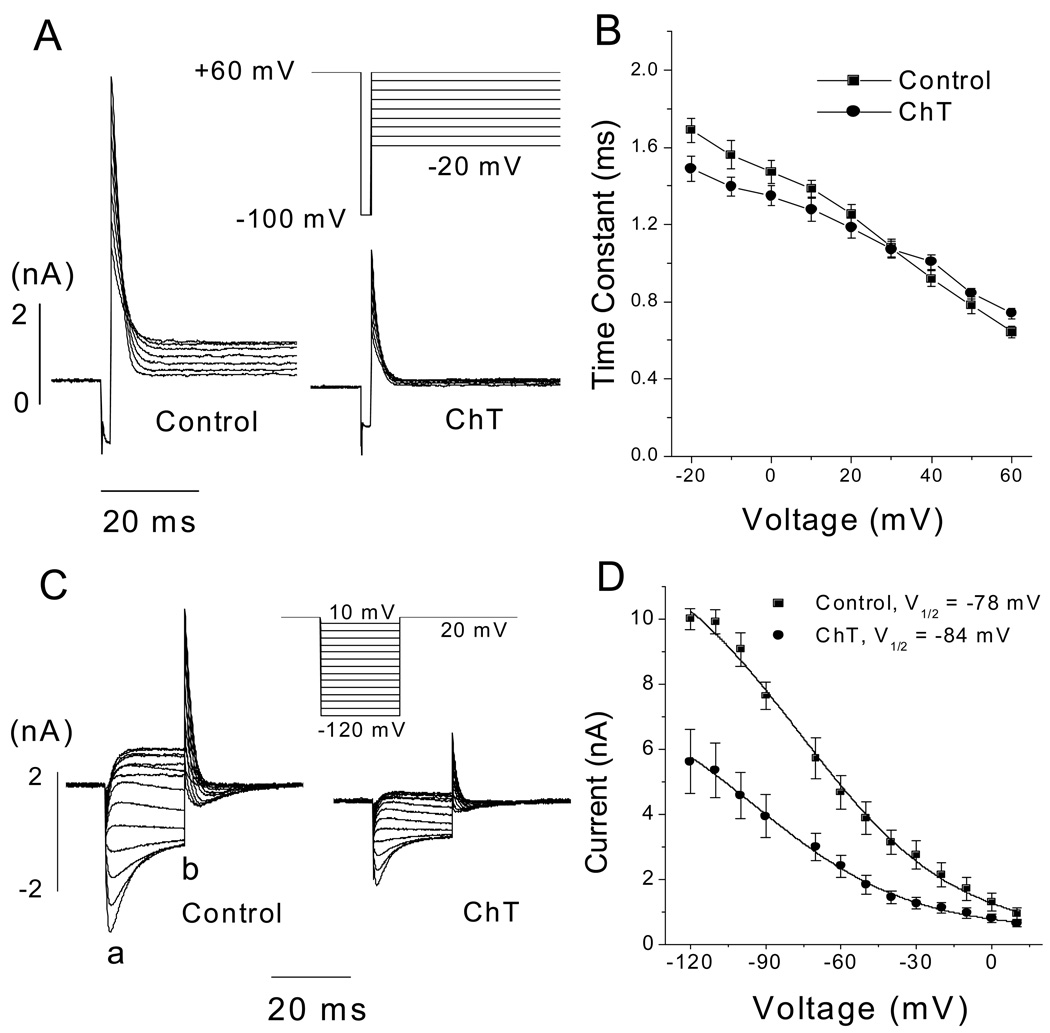
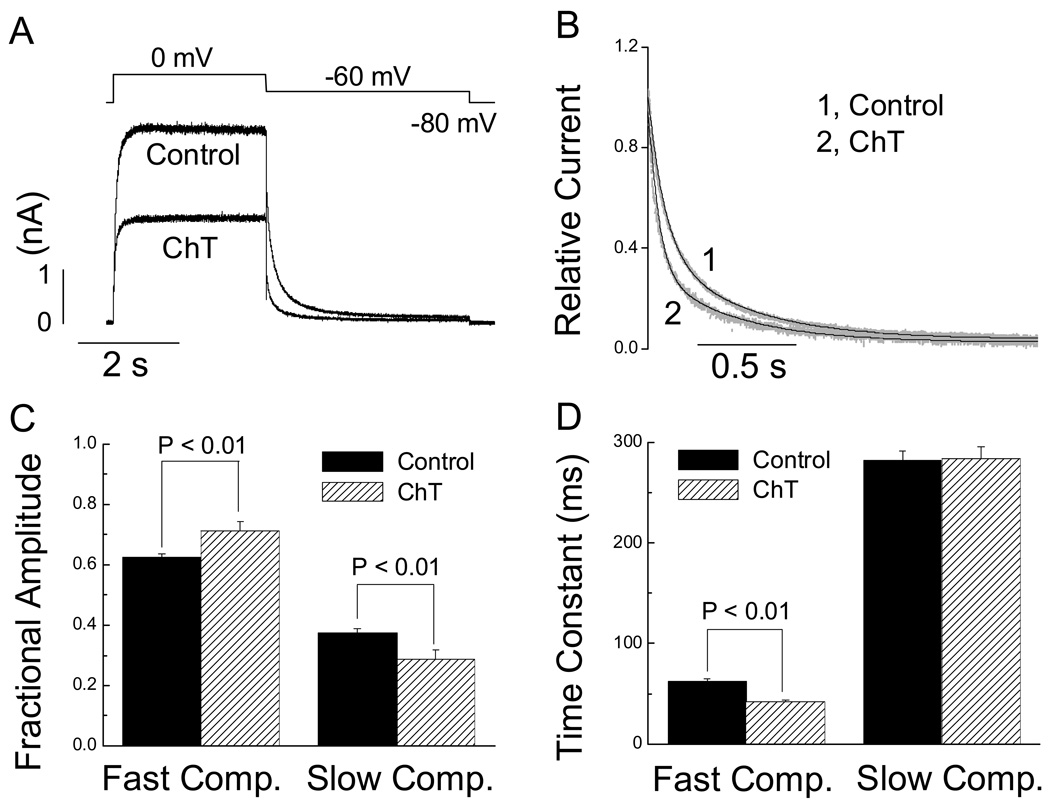
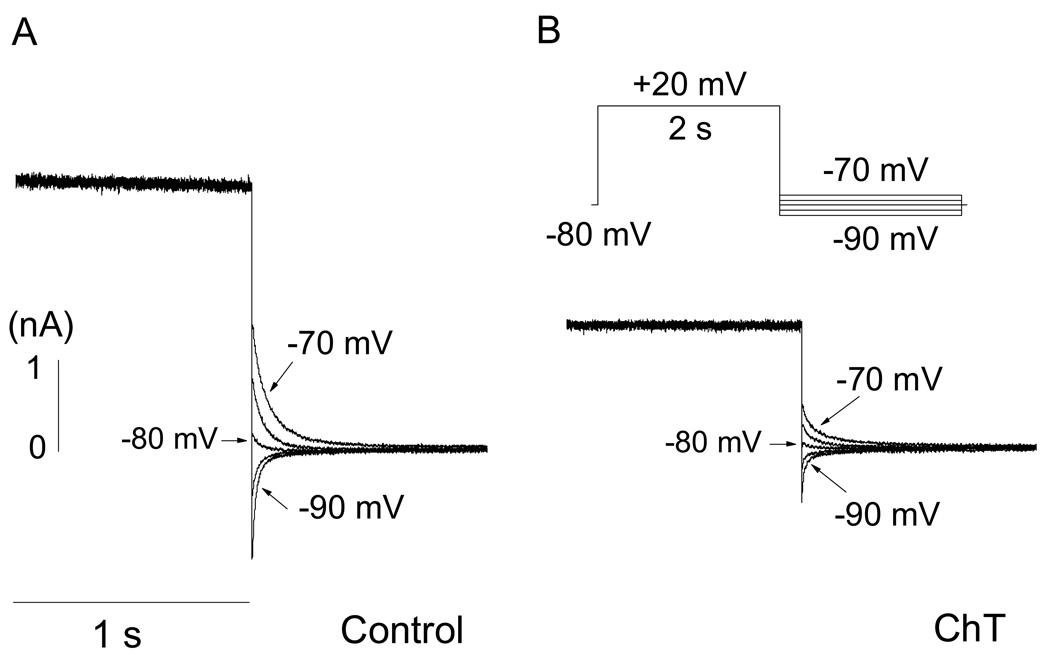
Reactive species oxidatively modify numerous proteins including ion channels. Oxidative sensitivity of ion channels is often conferred by amino acids containing sulfur atoms, such as cysteine and methionine. Functional consequences of oxidative modification of methionine in human ether à go-go related gene 1 (hERG1), which encodes cardiac I(Kr) channels, are unknown. Here we used chloramine-T (ChT), which preferentially oxidizes methionine, to examine the functional consequences of methionine oxidation of hERG channels stably expressed in a human embryonic kidney cell line (HEK 293) and native hERG channels in a human neuroblastoma cell line (SH-SY5Y). ChT (300 microM) significantly decreased whole-cell hERG current in both HEK 293 and SH-SY5Y cells. In HEK 293 cells, the effects of ChT on hERG current were time- and concentration-dependent, and were markedly attenuated in the presence of enzyme methionine sulfoxide reductase A that specifically repairs oxidized methionine. After treatment with ChT, the channel deactivation upon repolarization to -60 or -100 mV was significantly accelerated. The effect of ChT on channel activation kinetics was voltage-dependent; activation slowed during depolarization to +30 mV but accelerated during depolarization to 0 or -10mV. In contrast, the reversal potential, inactivation kinetics, and voltage-dependence of steady-state inactivation remained unaltered. Our results demonstrate that the redox status of methionine is an important modulator of hERG channel.
Figures
Similar articles
-
Properties of HERG channels stably expressed in HEK 293 cells studied at physiological temperature.Biophys J. 1998 Jan;74(1):230-41. doi: 10.1016/S0006-3495(98)77782-3. Biophys J. 1998. PMID: 9449325 Free PMC article.
-
Oxidative regulation of large conductance calcium-activated potassium channels.J Gen Physiol. 2001 Mar;117(3):253-74. doi: 10.1085/jgp.117.3.253. J Gen Physiol. 2001. PMID: 11222629 Free PMC article.
-
Mesoridazine: an open-channel blocker of human ether-a-go-go-related gene K+ channel.J Mol Cell Cardiol. 2004 Jan;36(1):151-60. doi: 10.1016/j.yjmcc.2003.10.017. J Mol Cell Cardiol. 2004. PMID: 14734057
-
Ceramide modulates HERG potassium channel gating by translocation into lipid rafts.Am J Physiol Cell Physiol. 2010 Jul;299(1):C74-86. doi: 10.1152/ajpcell.00462.2009. Epub 2010 Apr 7. Am J Physiol Cell Physiol. 2010. PMID: 20375276 Free PMC article.
-
Altered gating of HERG potassium channels by cobalt and lanthanum.Pflugers Arch. 2000 Jun;440(2):264-74. doi: 10.1007/s004240000263. Pflugers Arch. 2000. PMID: 10898527
Cited by
-
Defective protein repair under methionine sulfoxide A deletion drives autophagy and ARE-dependent gene transcription.Redox Biol. 2018 Jun;16:401-413. doi: 10.1016/j.redox.2018.04.001. Epub 2018 Apr 3. Redox Biol. 2018. PMID: 29649787 Free PMC article.
-
A Memory Molecule, Ca(2+)/Calmodulin-Dependent Protein Kinase II and Redox Stress; Key Factors for Arrhythmias in a Diseased Heart.Korean Circ J. 2013 Mar;43(3):145-51. doi: 10.4070/kcj.2013.43.3.145. Korean Circ J. 2013. PMID: 23613689 Free PMC article.
-
Oxidation of multiple methionine residues impairs rapid sodium channel inactivation.Pflugers Arch. 2008 Sep;456(6):1085-95. doi: 10.1007/s00424-008-0477-6. Epub 2008 Mar 28. Pflugers Arch. 2008. PMID: 18369661 Free PMC article.
-
Regulation of protein function by reversible methionine oxidation and the role of selenoprotein MsrB1.Antioxid Redox Signal. 2015 Oct 1;23(10):814-22. doi: 10.1089/ars.2015.6385. Epub 2015 Jul 16. Antioxid Redox Signal. 2015. PMID: 26181576 Free PMC article. Review.
-
Unusual case of severe arrhythmia developed after acute intoxication with tosylchloramide.BMC Pharmacol Toxicol. 2013 Jan 24;14:8. doi: 10.1186/2050-6511-14-8. BMC Pharmacol Toxicol. 2013. PMID: 23347670 Free PMC article.
References
-
- Sanguinetti MC, Jiang C, Curran ME, Keating MT. A mechanistic link between an inherited and an acquired cardiac arrhythmia: HERG encodes the IKr potassium channel. Cell. 1995;81:299–307. - PubMed
-
- Trudeau MC, Warmke JW, Ganetzky B, Robertson GA. HERG, a human inward rectifier in the voltage-gated potassium channel family. Science. 1995;269:92–95. - PubMed
-
- Viskin S. Long QT syndromes and torsade de pointes. Lancet. 1999;354:1625–1633. - PubMed
-
- Keating MT, Sanguinetti MC. Molecular and cellular mechanisms of cardiac arrhythmias. Cell. 2001;104:569–580. - PubMed
-
- Keating MT. Genetic approaches to cardiovascular disease. Supravalvular aortic stenosis, Williams syndrome, and long-QT syndrome. Circulation. 1995;92:142–147. - PubMed
Publication types
MeSH terms
Substances
Grants and funding
LinkOut - more resources
Full Text Sources
Miscellaneous
