

Tuberculosis incidence in Portugal: spatiotemporal clustering
- PMID: 17625009
- PMCID: PMC1965471
- DOI: 10.1186/1476-072X-6-30
Tuberculosis incidence in Portugal: spatiotemporal clustering
Abstract
Background: The statistics of disease clustering is one of the most important tools for epidemiologists to detect and monitor public health disease patterns. Nowadays, tuberculosis (TB)--an infectious disease caused by the Mycobacterium tuberculosis--presents different (development in populations and antibiotics resistance) patterns and specialists are very concerned with it and its association to several other diseases and factors. Each year, tuberculosis kills about three million people in the world. In particular, it is responsible for the death of more than one-third of HIV-infected people, who prove particularly susceptible due to a decline in their immune defences. The purpose of this study is to determine if there are spatiotemporal tuberculosis incidence clusters in continental Portugal. The presented case study is based on the notification of new tuberculosis cases (disease incidence), between 2000 and 2004. In methodological terms, the spatial scan statistic, used to identify spatiotemporal clusters, was improved by including two new approaches: definition of window sizes in the cluster scanning processes considering empirical mean spatial semivariograms and an independent and posterior validation of identified clusters (based on geostatistical simulations).
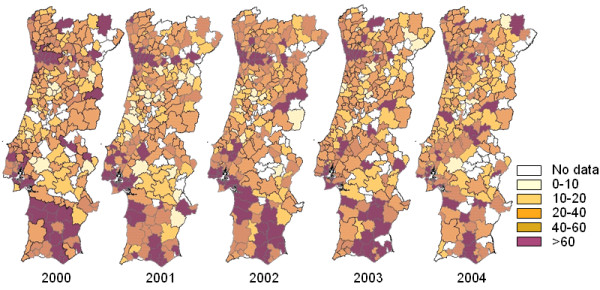
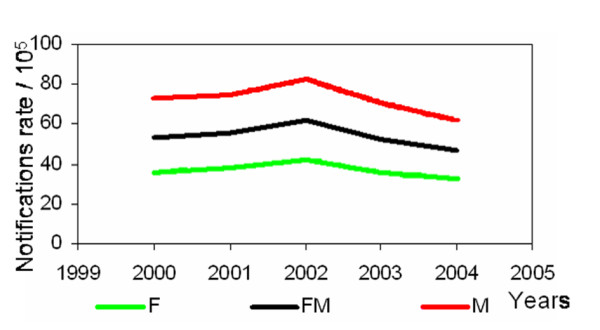
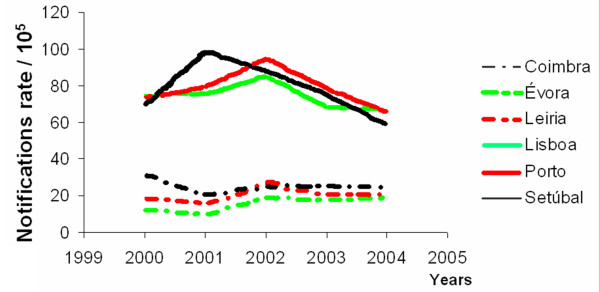
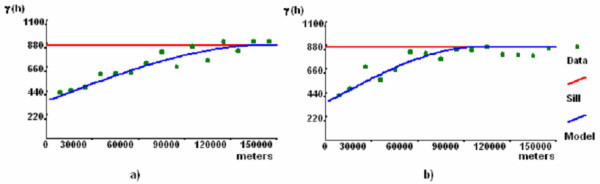
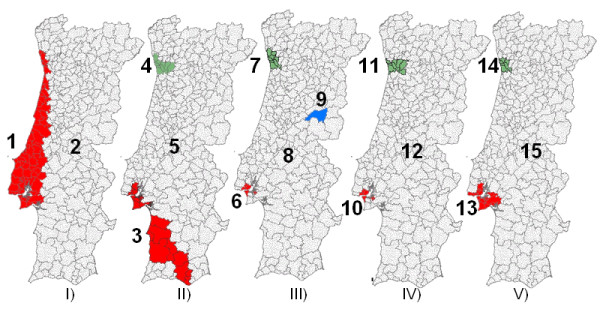
Results: Continental Portugal is organized in 18 districts with 278 sub-districts. For this case study, the number of new notified cases of TB, per sub-district and per year (2000-2004) was available. TB incidence presents clear spatial patterns: a semivariogram consistent with 40% of nugget effect and 60% of spatial contribution, following an exponential model with a range of 143 kilometres. Temporal semivariograms were not conclusive, as only 5 years of data were available. The spatial and temporal persistence of clusters were analyzed considering different models. Significant high incidence rate space-time clusters were identified in three areas of Portugal (between 2000 and 2004) and a purely temporal cluster was identified covering the whole country, during 2002.
Conclusion: In terms of spatiotemporal clustering of tuberculosis disease, the proposed methodology allowed the identification of critical spatiotemporal areas. In Portugal there were 3 critical districts (Porto, Setúbal and Lisbon) with high rates of notified incidences between 2000 and 2004. In methodological terms, semivariogram parameters were successfully applied to define spatiotemporal scan window sizes and shapes (ellipsoidal cylinders), showing very good results and performances in the case study. After defining the clusters, these were authenticated through a validation method, based on geostatistical simulations.
Figures
References
-
- WHO Treatment of tuberculosis Guidelines for National Programmes Geneva. 1997.
-
- Frieden T. Can tuberculosis be controlled? International Journal of Epidemiology. 2002;31:894–899. - PubMed
-
- Howe GM. In: Historical Evolution of disease mapping in general and specifically of cancer mapping Recent results of cancer research – cancer mapping. Boyele P, Muir CS, Grundman E, editor. Springer Verlag, Berlin; 1989. - PubMed
-
- Elliot P, Cuzick J, English D, Stern R. Geographical and Environmental Epidemiology. Oxford University Press, New York; 1992.
-
- Porter J. Geographical information systems (GIS) and the tuberculosis DOTS strategy. Tropical Medicine and Internation Health. 1999;4:631–633. - PubMed
Publication types
MeSH terms
LinkOut - more resources
Full Text Sources
Medical
