. 2007 Jul 11:8:246.
doi: 10.1186/1471-2105-8-246.

Simcluster: clustering enumeration gene expression data on the simplex space

Affiliations

Simcluster: clustering enumeration gene expression data on the simplex space

Ricardo Z N Vêncio et al. BMC Bioinformatics. .

Abstract

Background: Transcript enumeration methods such as SAGE, MPSS, and sequencing-by-synthesis EST "digital northern", are important high-throughput techniques for digital gene expression measurement. As other counting or voting processes, these measurements constitute compositional data exhibiting properties particular to the simplex space where the summation of the components is constrained. These properties are not present on regular Euclidean spaces, on which hybridization-based microarray data is often modeled. Therefore, pattern recognition methods commonly used for microarray data analysis may be non-informative for the data generated by transcript enumeration techniques since they ignore certain fundamental properties of this space.

Results: Here we present a software tool, Simcluster, designed to perform clustering analysis for data on the simplex space. We present Simcluster as a stand-alone command-line C package and as a user-friendly on-line tool. Both versions are available at: http://xerad.systemsbiology.net/simcluster.

Conclusion: Simcluster is designed in accordance with a well-established mathematical framework for compositional data analysis, which provides principled procedures for dealing with the simplex space, and is thus applicable in a number of contexts, including enumeration-based gene expression data.


Figures

Figure 1
Figure 1
Screenshot of an analysis session using Simcluster's web-based interface. Simcluster's on-line version was designed to be a user-friendly interface for the command-line version. The screenshot shown is an illustration of an interactive session usign the example data provided.
Figure 2
Figure 2
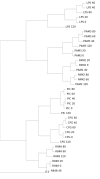
Clustering analysis of the Affymetrix dataset. Data produced by the Innate Immunity Systems Biology project [32,33] and available as Additional File 3. This data is a set of Affymetrix experiments of mouse macrophages stimulated by different Toll-like receptor agonists (LPS, PIC, CPG, R848, PAM) during a time-course (0, 20, 40, 60, 80 and 120 minutes). Method: Euclidean distance with average linkage agglomerative hierarchical clustering.
Figure 3
Figure 3
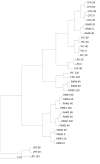
Simcluster's clustering of simulated data based on Affymetrix expression levels. Transcript enumeration data produced by the simulation of a virtual transcriptome according to the Affymetrix expression levels. Sample size n = 100,000,000. Method: Simcluster's average linkage agglomerative hierarchical clustering.
Figure 4
Figure 4
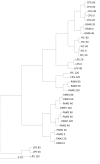
Clustering of simulated data using Euclidean distance. Transcript enumeration data produced by the simulation of a virtual transcriptome according to the Affymetrix expression levels. Sample size n = 100,000,000. Method: Euclidean distance with average linkage agglomerative hierarchical clustering.
Figure 5
Figure 5
Clustering of simulated data using correlation distance. Transcript enumeration data produced by the simulation of a virtual transcriptome according to the Affymetrix expression levels. Sample size n = 100,000,000. Method: correlation-based distance with average linkage agglomerative hierarchical clustering.
Figure 6
Figure 6
Clustering of simulated data using cosine distance. Transcript enumeration data produced by the simulation of a virtual transcriptome according to the Affymetrix expression levels. Sample size n = 100,000,000. Method: cosine distance with average linkage agglomerative hierarchical clustering.

References

    1. Schena M, Shalon D, Davis R, Brown P. Quantitative monitoring of gene expression patterns with a complementary DNA microarray. Science. 1995;8(5235):467–470. doi: 10.1126/science.270.5235.467. - DOI - PubMed
    1. Fodor S, Rava R, Huang X, Pease A, Holmes C, Adams C. Multiplexed biochemical assays with biological chips. Nature. 1993;8:555–556. doi: 10.1038/364555a0. - DOI - PubMed
    1. Velculescu V, Zhang L, Vogelstein B, Kinzler K. et al.Serial analysis of gene expression. Science. 1995;8(5235):484–487. doi: 10.1126/science.270.5235.484. - DOI - PubMed
    1. Brenner S, Johnson M, Bridgham J, Golda G, Lloyd D, Johnson D, Luo S, McCurdy S, Foy M, Ewan M. et al.Gene expression analysis by massively parallel signature sequencing (MPSS) on microbead arrays. Nature Biotechnology. 2000;8:630–634. doi: 10.1038/76469. - DOI - PubMed
    1. Okubo K, Hori N, Matoba R, Niiyama T, Fukushima A, Kojima Y, Matsubara K. Large scale cDNA sequencing for analysis of quantitative and qualitative aspects of gene expression. Nature Genetics. 1992;8:173–179. doi: 10.1038/ng1192-173. - DOI - PubMed

Publication types

MeSH terms

Substances