. 2007 Oct;77(4):723-33.
doi: 10.1095/biolreprod.107.062513. Epub 2007 Jul 11.

Gfra1 silencing in mouse spermatogonial stem cells results in their differentiation via the inactivation of RET tyrosine kinase

Affiliations

Gfra1 silencing in mouse spermatogonial stem cells results in their differentiation via the inactivation of RET tyrosine kinase

Zuping He et al. Biol Reprod. 2007 Oct.

Abstract

Spermatogenesis is the process by which spermatogonial stem cells divide and differentiate into sperm. The role of growth factor receptors in regulating self-renewal and differentiation of spermatogonial stem cells remains largely unclear. This study was designed to examine Gfra1 receptor expression in immature and adult mouse testes and determine the effects of Gfra1 knockdown on the proliferation and differentiation of type A spermatogonia. We demonstrated that GFRA1 was expressed in a subpopulation of spermatogonia in immature and adult mice. Neither Gfra1 mRNA nor GFRA1 protein was detected in pachytene spermatocytes and round spermatids. GFRA1 and POU5F1 (also known as OCT4), a marker for spermatogonial stem cells, were co-expressed in a subpopulation of type A spermatogonia from 6-day-old mice. In addition, the spermatogonia expressing GFRA1 exhibited a potential for proliferation and the ability to form colonies in culture, which is a characteristic of stem cells. RNA interference assays showed that Gfra1 small interfering RNAs (siRNAs) knocked down the expression of Gfra1 mRNA and GFRA1 protein in type A spermatogonia. Notably, the reduction of Gfra1 expression by Gfra1 siRNAs induced a phenotypic differentiation, as evidenced by the elevated expression of KIT, as well as the decreased expression of POU5F1 and proliferating cell nuclear antigen (PCNA). Furthermore, Gfra1 silencing resulted in a decrease in RET phosphorylation. Taken together, these data indicate that Gfra1 is expressed dominantly in mouse spermatogonial stem cells and that Gfra1 knockdown leads to their differentiation via the inactivation of RET tyrosine kinase, suggesting an essential role for Gfra1 in spermatogonial stem cell regulation.


Figures

FIG. 1
FIG. 1
Gfra1 mRNA and GFRA1 protein expression in seminiferous tubules and various cell populations from immature and adult mice. A) RT-PCR analysis shows that Gfra1 mRNA is detected in seminiferous tubules and type A spermatogonia of immature mice but not in pachytene spermatocytes or round spermatids of adult mice. Gapdh served as a loading control of total RNA. B) Western blot analysis shows that GFRA1 protein is detected in seminiferous tubules and type A spermatogonia of immature mice but not in pachytene spermatocytes or round spermatids of adult mice. Molecular mass standards are shown on the left, and ACTB serves as a loading control of total proteins.
FIG. 2
FIG. 2
Immunohistochemistry shows GFRA1 localization in the testis sections of immature and adult mice. A) GCNA1 was used as a positive control of staining in type A spematogonia (arrows) in the 6-day-old mice, whereas Sertoli cells (arrowheads) were negative. B) GATA4 was used as a positive control of staining in Sertoli cells (arrowheads) in the 6-day-old mice, whereas type A spematogonia (arrows) were negative for GATA4. C) A subset of the type A spermatogonia (arrows) was positive for GFRA1 in immature mice, whereas Sertoli cells (small arrowheads) were negative for GFRA1. Some of the type A spermatogonia (large arrowheads) were negative for GFRA1 in immature mice. D) Replacement of the primary antibody with PBS in the immature mouse testis section was used as a negative control. E) A subpopulation of spermatogonia (small arrows) was positive for GFRA1, whereas the differentiated germ cells, such as pachytene spermatocytes (small arrowheads), round spermatids (large arrowheads), and elongating spermatids (large arrows), were negative for this protein. F) Replacement of the primary anti-body with PBS in the adult mouse testis sections was used as a negative control. Bars = 20 μm.
FIG. 3
FIG. 3
Immunocytochemistry displays GFRA1 expression in various cell populations from immature and adult mice. A) A subpopulation of type A spermatogonia (arrowheads) from 6-day-old mice co-expressed GFRA1 (green fluorescence, arrowheads) and POU5F1 (red fluorescence, nuclei, arrowheads). A subset of type A spermatogonia shown by DAPI staining (blue fluorescence, arrows) was negative for GFRA1 or POU5F1. B) Germ cell colonies generated from type A spermatogonia in culture on Sertoli cell feeder layer also exhibited positive staining for GFRA1 (green fluorescence, arrowheads), whereas Sertoli cells were negative, as shown by DAPI staining (blue fluorescence, arrow). C) A subset of germ cells from adult mouse testis was positive for GFRA1 (green fluorescence, arrow); GCNA1 (red fluorescence, nuclei) was used to show the nuclei of germ cells. D) Pachytene spermatocytes were negative for GFRA1 but were positive for GCNA1 (red fluorescence, nuclei). E) Round spermatids were negative for GFRA1 but exhibited GCNA1 staining (red fluorescence, nuclei). Bars = 10 μm.
FIG. 4
FIG. 4
ELISA shows the GDNF production by Sertoli cells in culture. Sertoli cells were cocultured with type A spermatogonia for 6 days, and culture medium was harvested at different time points, as indicated in Materials and Methods. GDNF concentration was determined by measuring the absorbance of the samples at 450-nm wavelength using an Ultra Microplate reader.
FIG. 5
FIG. 5
Gfra1 siRNAs knock down Gfra1 mRNA and GFRA1 protein in type A spermatogonia of immature mice. A) Transfection efficiency was monitored by the uptake of the BLOCK-iT fluorescent oligo (green fluorescence) at 24 h following transfection using Lipofectamine 2000. Representatives of the transfected type A spermatogonia are indicated by red arrowheads. Note the nuclei staining of the cells (green fluorescence). B) The phase-contrast imaging of A. C) Semiquantitative RT-PCR analysis shows Gfra1 mRNA expression in type A spermatogonia with or without Gfra1 siRNA treatment at 48 h after transfection. The numbers below the lanes show the fold decrease of Gfra1 mRNA relative to control after normalization to the signal obtained with Gapdh. D) Western blot analysis shows GFRA1 protein expression in type A spermatogonia with or without Gfra1 siRNA treatment at 48 h after transfection. The numbers below the lanes show the fold decrease of GFRA1 protein relative to control after normalization to the signal obtained with ACTB. E) Real-time quantitative RT-PCR analysis reveals Gfra1 mRNA relative level in type A spermatogonia with or without Gfra1 siRNA treatment at 48 h after transfection. Each bar represents the mean of three real-time quantitative PCRs, with SEM shown by vertical lines. Gfra1 siRNA treatment groups with P < 0.05 are indicated by asterisks. Bars = 20 μm (A, B).
FIG. 6
FIG. 6
Immunofluorescent analysis displays GFRA1 protein expression in type A spermatogonia with or without Gfra1 siR-NAs treatment at 48 h after transfection. The expression of GFRA1 decreased in type A spermatogonia with Gfra1 siRNAs treatment compared with the negative control siRNA and the no-siRNA group, as indicated by arrows (green fluorescence). Staining with DAPI (blue fluorescence) was used to identify the nuclei of type A spermatogonia and Sertoli cells. Bars = 20 μm.
FIG. 7
FIG. 7
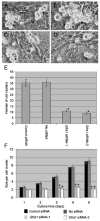
The effect of Gfra1 knockdown on the proliferation of type A spermatogonia. A) Negative control siRNA transfection. B) Without siRNA transfection. In A, four clusters (asterisks) are shown, each containing five or more cells. Similarly, clusters are shown in B. C) Gfra1 siRNA-1 transfection. D) Gfra1 siRNA-2 transfection. Fewer clusters (containing two or more cells; asterisks) are noted in C and D compared with the clusters in A and B.E) The number of cell clusters in type A spermatogonia with or without Gfra1 siRNAs treatment at the fourth day after transfection. F) The size of germ cell clusters (number of cells per cluster) at different time points with or without Gfra1 siRNA treatment. Most cells after Gfra1 siRNA treatment remain single or undergo only one or two divisions, producing small clusters, whereas the cells in the Gfra1 siRNA untreated controls proliferate and form larger clusters with more germ cells in each cluster. The total cell number was counted from all the clusters in each group, and the size of the clusters is presented as the mean of cell number per cell cluster. Gfra1 siRNA treatment groups with P < 0.05 are indicated by asterisks. Bars = 10 μm (AD).
FIG. 8
FIG. 8
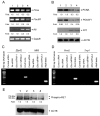
The expression of PCNA, POU5F1, KIT, Zfp42, Mtl5, Prm2, Tnp1, and RET phosphorylation in type A spermatogonia with or without Gfra1 siRNA treatment. A) Semiquantitative RT-PCR analysis shows mRNA expression of Pcna, Pou5f1, and Kit in type A spermatogonia with or without Gfra1 siRNA treatment at 48 h after transfection. The numbers below the lanes show the fold of Pcna, Pou5f1, and Kit mRNA relative to control after normalization to the signal obtained with Gapdh. Lane 1: the negative control siRNA group; lane 2: the no-siRNA group; lane 3: Gfra1 siRNA-1 treatment; lane 4: Gfra1 siRNA-2 treatment. B) Western blot analysis reveals protein expression of PCNA, POU5F1, and KIT in type A spermatogonia with or without Gfra1 siRNA treatment at 48 h after transfection. The numbers below the lanes show the fold of PCNA, POU5F1, and KIT protein relative to control after normalization to the signal obtained with ACTB. Lane 1: the negative control siRNA treatment group; lane 2: the no-siRNA group; lane 3: Gfra1 siRNA-1 treatment; lane 4: Gfra1 siRNA-2 treatment. C) RT-PCR analysis displays Zfp42 and Mtl5 mRNA expression in type A spermatogonia with or without Gfra1 siRNAs treatment at Day 5 after transfection. The expression of Zfp42 and Mtl5 mRNA in adult mouse testis was used as a positive control. D) RT-PCR analysis reveals Prm2 and Tnp1 mRNA expression in type A spermatogonia with or without Gfra1 siRNAs treatment at Day 10 after transfection. The expression of Prm2 and Tnp1 mRNA in adult testis served as a positive control. E) The expression changes of RET phosphorylation in type A spermatogonia and Sertoli cells with or without Gfra1 siRNAs treatment. Total protein (90 μg) from each sample were used for SDS-PAGE. The molecular mass standards are shown on the left, and the numbers below the lanes show the fold decrease of RET phosphorylation relative to control after normalization to the signal obtained with ACTB. Lane 1: the negative control siRNA group; lane 2: the no-siRNA group; lane 3: Gfra1 siRNA-1 treatment; lane 4: Gfra1 siRNA-2 treatment.

Similar articles

Cited by

References

    1. de Rooij DG. Proliferation and differentiation of spermatogonial stem cells. Reproduction. 2001;121:347–354. - PubMed
    1. Brinster RL. Germline stem cell transplantation and transgenesis. Science. 2002;296:2174–2176. - PMC - PubMed
    1. Dym M. Spermatogonial stem cells of the testis. Proc Natl Acad Sci U S A. 1994;91:11287–11289. - PMC - PubMed
    1. Lin LF, Doherty DH, Lile JD, Bektesh S, Collins F. GDNF: a glial cell line-derived neurotrophic factor for midbrain dopaminergic neurons. Science. 1993;260:1130–1132. - PubMed
    1. Garces A, Haase G, Airaksinen MS, Livet J, Filippi P, deLapeyriere O. GFRalpha 1 is required for development of distinct subpopulations of motoneuron. J Neurosci. 2000;20:4992–5000. - PMC - PubMed

Publication types

MeSH terms