. 2007 Jul 17;104(29):12111-6.
doi: 10.1073/pnas.0702969104. Epub 2007 Jul 11.

Somatic loss of BRCA1 and p53 in mice induces mammary tumors with features of human BRCA1-mutated basal-like breast cancer

Affiliations

Somatic loss of BRCA1 and p53 in mice induces mammary tumors with features of human BRCA1-mutated basal-like breast cancer

Xiaoling Liu et al. Proc Natl Acad Sci U S A. .

Abstract

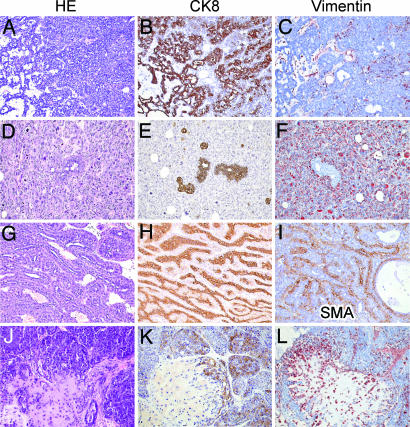
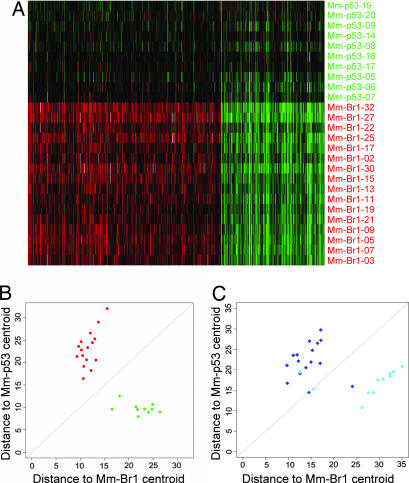
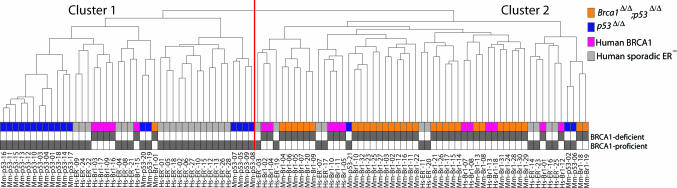
Women carrying germ-line mutations in BRCA1 are strongly predisposed to developing breast cancers with characteristic features also observed in sporadic basal-like breast cancers. They appear as high-grade tumors with high proliferation rates and pushing borders. On the molecular level, they are negative for hormone receptors and ERBB2, display frequent TP53 mutations, and express basal epithelial markers. To study the role of BRCA1 and P53 loss of function in breast cancer development, we generated conditional mouse models with tissue-specific mutation of Brca1 and/or p53 in basal epithelial cells. Somatic loss of both BRCA1 and p53 resulted in the rapid and efficient formation of highly proliferative, poorly differentiated, estrogen receptor-negative mammary carcinomas with pushing borders and increased expression of basal epithelial markers, reminiscent of human basal-like breast cancer. BRCA1- and p53-deficient mouse mammary tumors exhibit dramatic genomic instability, and their molecular signatures resemble those of human BRCA1-mutated breast cancers. Thus, these tumors display important hallmarks of hereditary breast cancers in BRCA1-mutation carriers.


Conflict of interest statement

The authors declare no conflict of interest.

Figures

Fig. 1.
Fig. 1.
Incidence and spectrum of tumors in K14cre female mice carrying conditional Brca1F and p53F alleles. (A) Kaplan–Meier (K–M) survival curve of K14cre;p53F/F female mice (n = 32) showing a median tumor-free survival age (T50) of 288 days. (B) K–M curves of K14cre;p53F/F mice (blue curve) versus K14cre;Brca1F/F female mice (green curve; n = 11; T50 = 595 days; P < 0.0001) and K14cre;Brca1F/F;p53F/F female mice (orange curve; n = 50; T50 = 213 days; P < 0.0001). (C) K–M curve of K14cre;p53F/F mice (blue curve) versus K14cre;Brca1F/+;p53F/F female mice (pink curve; n = 19; T50 = 332 days; P = 0.218). (D) K–M curve of K14cre;Brca1F/F;p53F/+ female mice (red curve; n = 16; T50 = 407 days). Tumor types (mammary, skin, or other) are indicated for each female. Mice were killed when mammary tumors reached a diameter of ≈1 cm or skin tumors grew to a size of ≈0.7 cm. For mice with both skin and mammary tumors, the size of the latter was used as the criterion. (E) Southern blot analysis of tumor DNA to detect Cre-mediated deletion and spontaneous loss of Brca1 (EcoRV + StuI digest, Brca1 exon 14 probe) and p53 (BglII digest, p53 XbaI probe). Tumors (T) and control spleens (C) from the same animal are shown for representative female mice (–6) of each genotype.
Fig. 2.
Fig. 2.
Histopathological features of mammary tumors from K14cre;p53F/F and K14cre;Brca1F/F;p53F/F female mice. Microphotographs of representative tumor sections stained with H&E (A, D, G, and J), or with antibodies against CK8 (B, E, H, and K), vimentin (C, F, and L), or smooth muscle actin (SMA) (I). (A–C) Solid carcinoma, resembling high-grade IDC-nos in humans. (D–F) Poorly differentiated biphasic carcinoma, resembling carcinosarcoma in humans. (G–I) Well differentiated biphasic carcinoma, resembling adenomyoepithelioma in humans. (J–L) Carcinoma with chondroid metaplasia.
Fig. 3.
Fig. 3.
Loss of BRCA1 induces genomic instability. (A and B) Array-CGH profiles of representative mammary tumors from K14cre;p53F/F and K14cre;Brca1F/F;p53F/F mice, respectively. Log2 hybridization ratios are plotted for 2,803 BAC clones, represented on the CGH microarray, at their genomic position. Red dots represent amplifications >0, and green dots represent deletions <0 (Rosetta error model; P < 0.01). (C) Comparison of array-CGH profiles of tumors from K14cre;Brca1F/F;p53F/F (n = 26) and K14cre;p53F/F (n = 27) mice shows that BRCA1 loss results in a significant increase of CNAs. Depicted are mean percentages of BACs with a P < 0.01 per tumor group and per chromosome. Statistical significance of the observed differences in percentage of CNAs between both groups was calculated using a two-sided t test (P = 0.00013).
Fig. 4.
Fig. 4.
Mammary tumors from K14cre;Brca1F/F;p53F/F female mice display characteristics of basal-like breast cancers. (A) Unsupervised hierarchical clustering of gene expression profiles from mammary tumors of K14cre;Brca1F/F;p53F/F (n = 32) and K14cre;p53F/F (n = 21) mice. Two-dimensional clustering based on Pearson correlation coefficients revealed three branches of genes that contained several markers for basal cell types. The complete heat map of all 5,237 significant genes is depicted in SI Fig. 8. The dendrogram shows that the majority of the p53Δ/Δ tumors (in blue) were separated from the Brca1Δ/Δ;p53Δ/Δ tumors (in orange). (B–G) Histochemical staining of mammary tumor sections from K14cre;Brca1F/F;p53F/F mice (B–D) and K14cre;p53F/F animals (E–G), with H&E (B and E) or with antibodies against p63 (C and F) and CK5 (D and G).
Fig. 5.
Fig. 5.
Supervised classification of mouse mammary tumors. (A) Expression data matrix of 646 BRCA1 reporter genes from a training set containing 16 Brca1Δ/Δ;p53Δ/Δ carcinomas (red) and 10 p53Δ/Δ carcinomas (green). Each row represents a tumor, and each column represents a gene. (B) Supervised classification of individual tumors from the training set according to their Euclidean distances to the centroids of mouse Brca1Δ/Δ;p53Δ/Δ mammary tumors and p53Δ/Δ tumors, respectively. (C) Supervised classification of an independent validation series containing 16 Brca1Δ/Δ;p53Δ/Δ tumors (dark blue diamonds) and 11 p53Δ/Δ tumors (light blue diamonds). Most mammary tumors in the validation series (23/27) were correctly classified by the 646 reporter genes.
Fig. 6.
Fig. 6.
Cross-species comparison of mouse and human BRCA1-deficient breast cancers. Unsupervised hierarchical clustering was used to compare gene expression profiles of human breast cancer samples from 16 BRCA1 mutation carriers (pink) and 28 sporadic ER-negative cases (gray), with profiles of 32 mammary tumors from K14cre;Brca1F/F;p53F/F female mice (orange) and 21 tumors from K14cre;p53F/F female mice (blue). Most mouse Brca1Δ/Δ;p53Δ/Δ and human BRCA1-mutated tumors (42 of 48) are interspersed and cluster together in a single branch of the dendrogram. The complete heat map of all 5,410 significant genes is shown in SI Fig. 10.

References

    1. Thompson D, Easton DF. J Natl Cancer Inst. 2002;94:1358–1365. - PubMed
    1. Wooster R, Weber BL. N Engl J Med. 2003;348:2339–2347. - PubMed
    1. Scully R, Livingston DM. Nature. 2000;408:429–432. - PMC - PubMed
    1. Narod SA, Foulkes WD. Nat Rev Cancer. 2004;4:665–676. - PubMed
    1. Venkitaraman AR. Cell. 2002;108:171–182. - PubMed

Publication types