. 2007 Jul 11;27(28):7365-76.
doi: 10.1523/JNEUROSCI.0956-07.2007.

Distinct structural and ionotropic roles of NMDA receptors in controlling spine and synapse stability

Affiliations

Distinct structural and ionotropic roles of NMDA receptors in controlling spine and synapse stability

Veronica A Alvarez et al. J Neurosci. .

Abstract

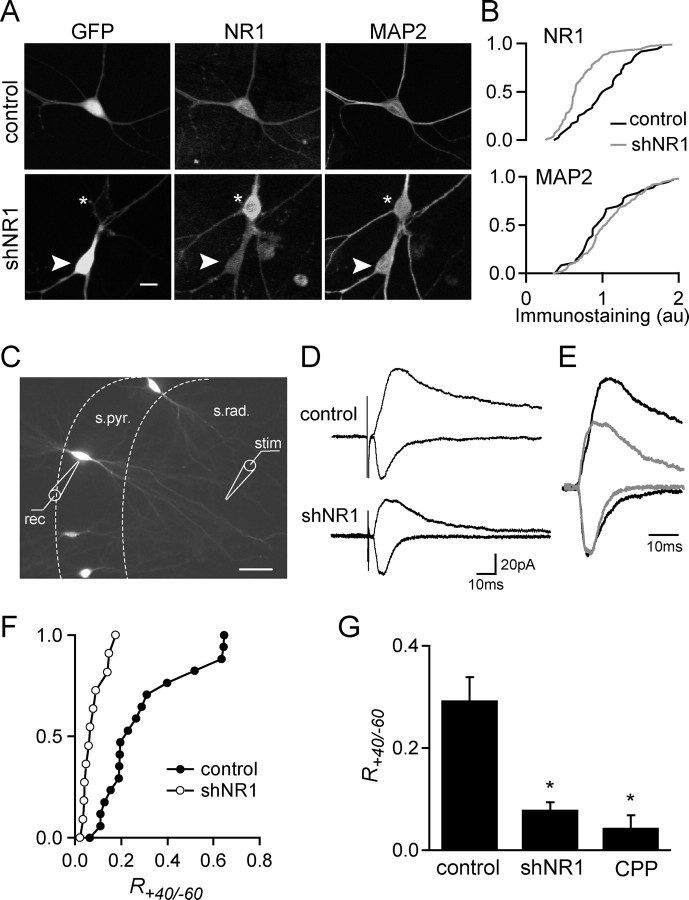
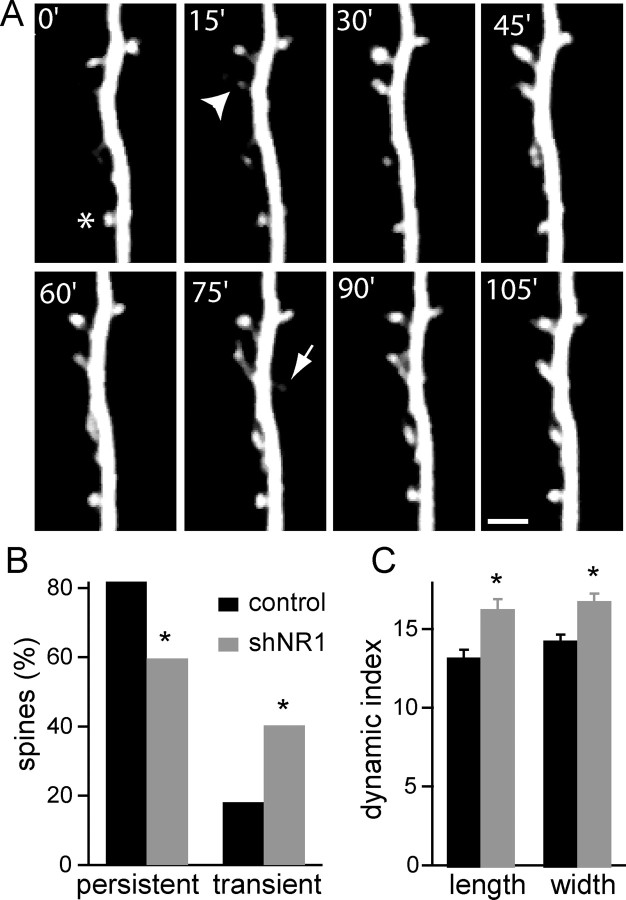
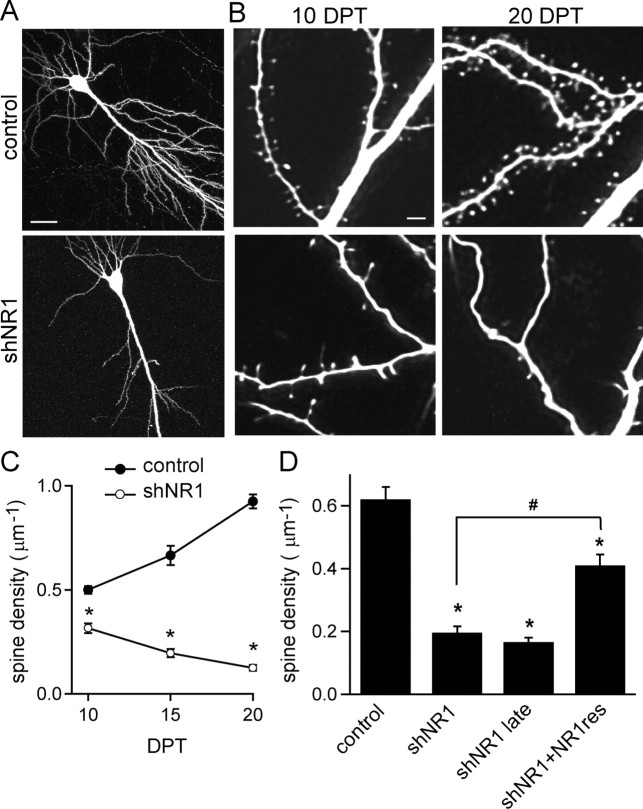
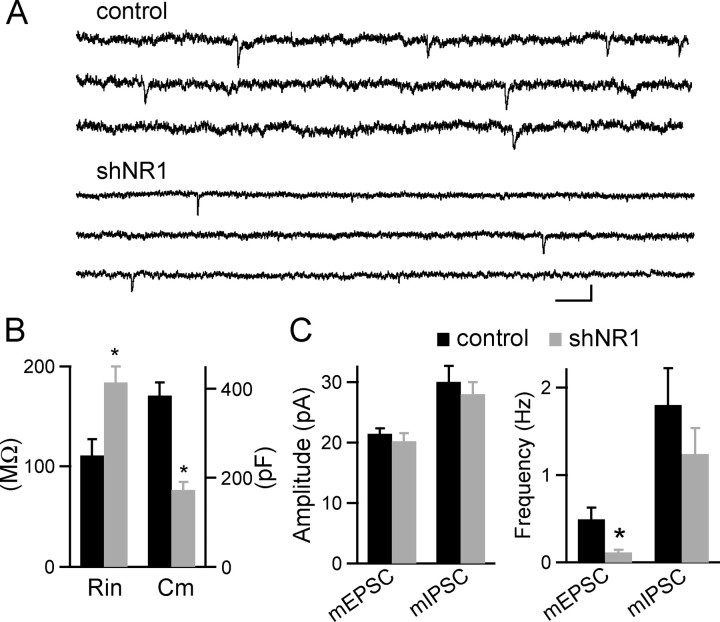
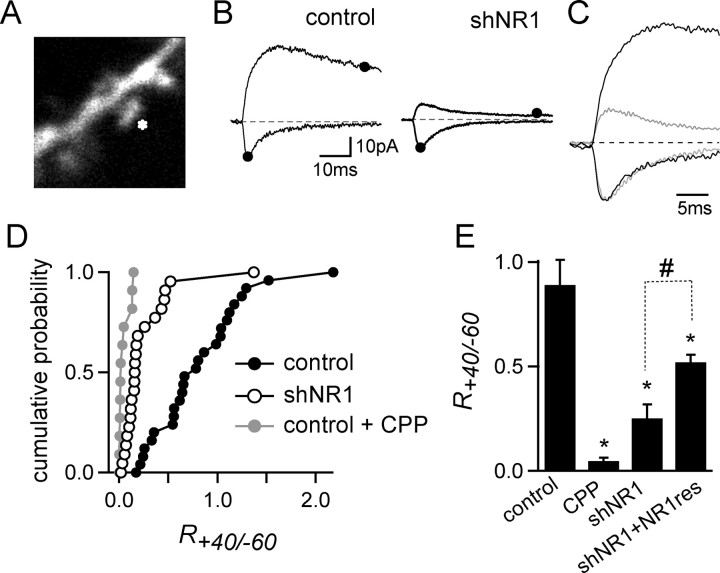
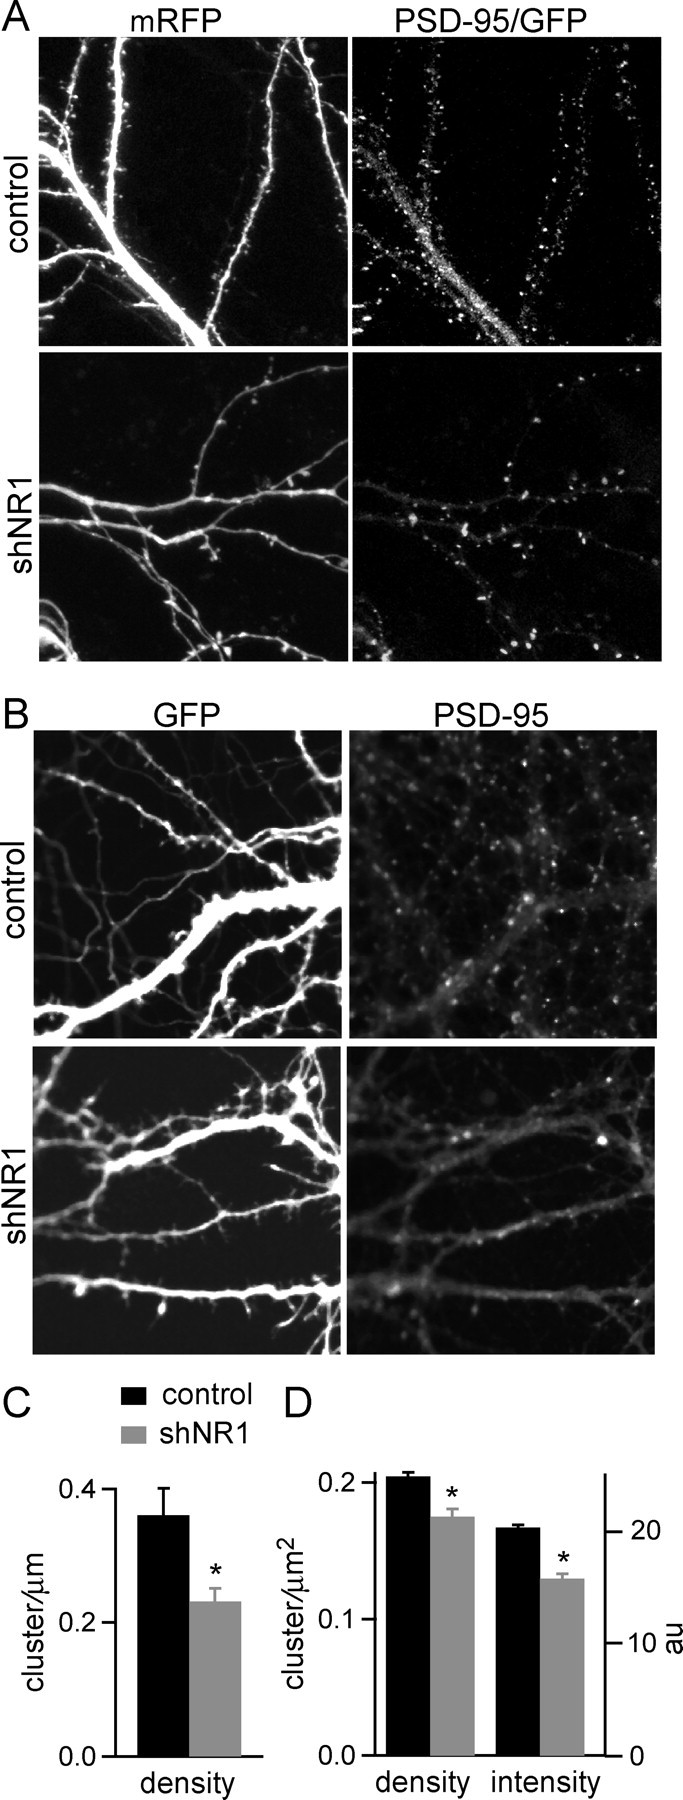
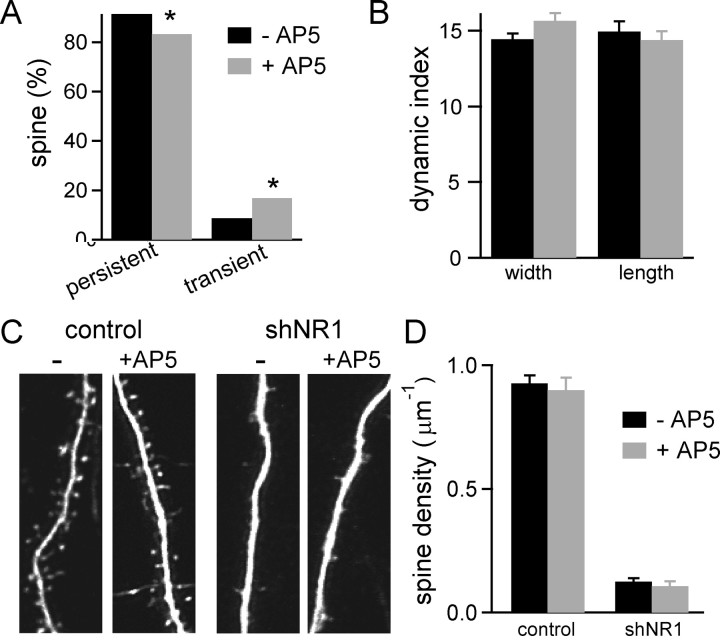
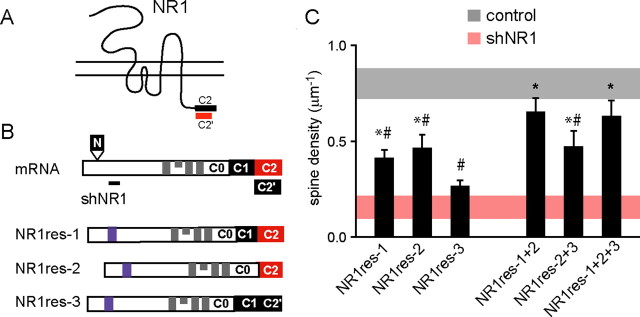
NMDA-type glutamate receptors (NMDARs) play a central role in the rapid regulation of synaptic transmission, but their contribution to the long-term stabilization of glutamatergic synapses is unknown. We find that, in hippocampal pyramidal neurons in rat organotypic slices, pharmacological blockade of NMDARs does not affect synapse formation and dendritic spine growth but does increase the motility of spines. Physical loss of synaptic NMDARs induced by RNA interference against the NR1 subunit of the receptor also increases the motility of spines. Furthermore, knock-down of NMDARs, but not their pharmacological block, destabilizes spine structure and over time leads to loss of spines and excitatory synapses. Maintenance of normal spine density requires the coexpression of two specific splice isoforms of the NR1 subunit that contain the C-terminal C2 cassette. Thus, although ionotropic properties of NMDARs induce synaptic plasticity, it is the physical interactions of the C-tail of the receptor that mediate the long-term stabilization of synapses and spines.


Figures

Figure 1.
Figure 1.
shRNA against NR1 reduces protein levels and NMDAR-mediated synaptic currents. A, Images of dissociated pyramidal neurons transfected with GFP control plasmid (top) or a dual-promoter plasmid coexpressing GFP and shNR1 (bottom). Neurons were transfected at 7 DIV and immunostained for NR1 and MAP2 at 10 d DPT. The arrowhead and asterisk indicate a transfected and untransfected neuron, respectively. B, Cumulative distribution of NR1 (top) and MAP2 (bottom) fluorescence immunostaining for control and shNR1-expressing neurons (n = 18–43). Data are from one of three independent experiments with similar results. The distributions of NR1 immunostaining are statistically different (p < 0.01, Kormogorov–Smirnov test). C, Wide-field fluorescence image of hippocampal organotypic slice showing sparse transfection of pyramidal neurons with GFP. The positions of the recording electrode (rec) in the stratum pyramidale (s.pyr.) and of the stimulating electrode (stim) in the stratum radiatum (s. rad.) are shown. D, EPSCs evoked by stimulation of Schaffer collaterals recorded from GFP-expressing (top) and shNR1-expressing (bottom) pyramidal neurons (10 DPT) at holding potentials of −60 mV (fast inward currents) and +40 mV (slow outward currents). Amplitudes were measured at the peak of the current at −60 mV and 150 ms after the peak at 40 mV. E, Normalized synaptic currents from control (black) and shNR1-expressing (gray) neurons showing the differences in time courses and amplitudes of the currents at +40 mV. F, Cumulative distribution of current ratios at +40 and −60 mV, R+40/−60, in GFP (control; filled circles) and shNR1-expressing (open circles) neurons at 10 DPT. Distributions are statistically different (p < 0.01, Kormogorov–Smirnov test). G, Average R+40/−60 measured in control NR1 knock-down neurons and control neurons in the presence of the NMDAR antagonist CPP (1 μm) at 10 DPT (n = 10–12). *p < 0.05 compared with control. Scale bars: A, 10 μm; C, 100 μm.
Figure 2.
Figure 2.
Increased motility of dendritic spines in shNR1 neurons. A, Time-lapse two-photon laser-scanning microscopic imaging of a spiny dendrite of a shNR1-expressing pyramidal neuron in a hippocampal organotypic slices at 10 DPT. Slices were bathed in slice culture medium at 30°C for the duration of the imaging session (90–120 min). The arrow marks a transient dendritic protrusion. Some spines change shape and size (arrowhead), whereas other spines preserved a relatively constant length and width (asterisk). Scale bar, 2.5 μm. B, Percentage of persistent spines (spines that are present for the entire imaging session) and transient dendritic protrusions (extensions and retractions) in control GFP (black) and shNR1 (gray) neurons at 10 DPT (n = 6–7 cells, 267–293 spines). The percentages in each category for control and shNR1 neurons are statistically different (p < 0.01, χ2 test). C, Dynamics indices of spine length and width of persistent spines in control (black) and shNR1 (gray) neurons (n = 6–7 cells, 214–235 spines). *p < 0.01.
Figure 3.
Figure 3.
Loss of dendritic spines in neurons with reduced synaptic NMDARs. A, Hippocampal pyramidal neurons in organotypic slices transfected with GFP (top) or shNR1 (bottom) imaged with a 2PLSM at 20 DPT. B, Higher-magnification images of dendrites from control (top) and shNR1 (bottom) neurons at 10 DPT (left) and 20 DPT (right). C, Developmental profile of spine density in control and shNR1 neurons (n = 10–28). D, Summary of spine density at 15 DPT in a variety of conditions. NR1res denotes the NR1-1-resistant clone with silent mutations in the region targeted by shNR1; shNR1 late summarizes data from neurons transfected with shNR1 at 8 DIV (instead of 3 DIV) and imaged at 10 DPT. Scale bars: A, 50 μm; B, 2 μm. *p < 0.05 compared with control; #p < 0.05 compared with shNR1 neurons; by ANOVA and Student–Newman–Keuls multiple comparisons test.
Figure 4.
Figure 4.
Loss of active synapses in neurons lacking synaptic NMDARs. A, Representative recordings of mEPSCs from control and shNR1 neurons at 20 DPT. Calibration: 200 ms, 20 pA. B, Summary of input resistance (Rin) and membrane capacitance (Cm) for control (black) and shNR1 (gray) neurons at 20 DPT (n = 21–26). *p < 0.05. C, Summary of mEPSC and mIPSC amplitude (left) and frequency (right) for control (black) and shNR1 (gray) neurons at 20 DPT (n = 15–18 and 12–13 for mEPSC and mIPSC, respectively). *p < 0.05.
Figure 5.
Figure 5.
Functional AMPARs are expressed in spines lacking NMDAR-mediated currents. A, Image of a spiny dendrite of a pyramidal neuron filled with Alexa Fluor-594 showing site of glutamate uncaging (asterisk). B, Currents evoked by 2PLU of glutamate on spines of control (left) and shNR1 (right) neurons held at −60 mV (inward current) and +40 mV (outward current). The amplitude of the currents mediated by AMPAR and NMDAR were measured at the times indicated by the filled dots. C, Normalized currents evoked by glutamate uncaging onto single spines from control (black) and shNR1 (gray) neurons recorded at −60 and +40 mV. D, Cumulative histogram plots of R+40/−60 measured at individual spines of control neurons (black circle), control neurons in CPP (1 μm; gray circles), and shNR1 neurons (open circles) at 10 DPT (n = 12–18). E, Average R+40/−60 from individual spines of control, control plus CPP, shNR1 neurons, and shNR1 neurons cotransfected with the NR1-1-resistant clone (shNR1+NR1res) at 10 DPT (n = 12–18). *p < 0.05 compared with control; #p < 0.05 compared with shNR1.
Figure 6.
Figure 6.
PSD-95 clusters form in remaining spines of shNR1 neurons. A, Images of dendritic branches of control (top) and shNR1 (bottom) pyramidal neurons in organotypic slices showing dendrite morphology (mRFP) and the distribution of PSD-95–GFP at 10 DPT. B, Dissociated pyramidal neurons expressing GFP (top) and shNR1 (bottom) showing GFP fluorescence and fluorescence immunostaining for endogenous PSD-95 at 10 DPT. C, Summary of linear density of PSD-95–GFP puncta in control (black) and shNR1 (gray) neurons in organotypic slices at 10 DPT (n = 6). *p < 0.05. D, Summary of immunostaining for endogenous PSD-95 puncta density and intensity for control (black) and shNR1 (gray) neurons in dissociated cultures at 10 DPT (n = 14–12). *p < 0.05.
Figure 7.
Figure 7.
Ionotropic properties of NMDAR regulate spine dynamics but not spine numbers. A, Percentage of persistent and transient spines in control untreated GFP neurons (−AP-5; black) and GFP neurons treated with 50 μm AP-5 (+AP-5; gray) for 8 d (n = 6 cells, 257–293 spines). The distributions for control and AP-5-treated neurons are statistically different (p < 0.01, χ2 test). B, Dynamics indices for spine length and width of persistent spines in untreated control (black) and AP-5-treated (gray) neurons. C, Dendrites of control and shNR1 pyramidal neurons in untreated (left) and AP-5-treated (right) slices at 20 DPT. Treatment with 50 μm AP-5 began at 10 DPT. D, Spine density of control and shNR1 pyramidal neurons at 20 DPT in untreated slices (black) and slices treated with AP-5 (gray).
Figure 8.
Figure 8.
Splice variants NR1-1 and NR1-2 are required for the maintenance of dendritic spines. A, Schematic structure of the NR1 subunit showing the C-terminal C2 and C2′ cassettes. B, Schematic of the NR1 mRNA (top) showing the four exons (N, C1, C2, C2′) that are differentially spliced to give rise to the NR1 isoforms. The back line indicates the shNR1 target region (not to scale). Schematics of the NR1 rescue clones (NR1res) used for the analyses of structural requirement are shown at the bottom. Blue areas indicate the mutated shNR1 target region, and gray areas represent the transmembrane domains. C, Summary of spine density at 15 DPT of pyramidal neurons transfected with NR1 rescue splice isoforms together with shNR1 (black bars). Shaded horizontal bars show the average ± 2*SEM of spine density for control (gray) and shNR1 (red) neurons at 15 DPT. *p < 0.05 compared with shNR1 neurons; #p < 0.05 compared with control neurons; by ANOVA and Student–Newman–Keuls multiple comparisons test.

References

    1. Alvarez VA, Ridenour DA, Sabatini BL. Retraction of synapses and dendritic spines induced by off-target effects of RNA interference. J Neurosci. 2006;26:7820–7825. - PMC - PubMed
    1. Arendt T. Alzheimer's disease as a disorder of mechanisms underlying structural brain self-organization. Neuroscience. 2001;102:723–765. - PubMed
    1. Barria A, Malinow R. Subunit-specific NMDA receptor trafficking to synapses. Neuron. 2002;35:345–353. - PubMed
    1. Bekkers JM, Stevens CF. NMDA and non-NMDA receptors are co-localized at individual excitatory synapses in cultured rat hippocampus. Nature. 1989;341:230–233. - PubMed
    1. Boyer C, Schikorski T, Stevens CF. Comparison of hippocampal dendritic spines in culture and in brain. J Neurosci. 1998;18:5294–5300. - PMC - PubMed

Publication types

MeSH terms

LinkOut - more resources