. 2007 Jul 11;27(28):7386-96.
doi: 10.1523/JNEUROSCI.5643-06.2007.

Role of the primate amygdala in fear-potentiated startle: effects of chronic lesions in the rhesus monkey

Affiliations

Role of the primate amygdala in fear-potentiated startle: effects of chronic lesions in the rhesus monkey

Elena A Antoniadis et al. J Neurosci. .

Abstract

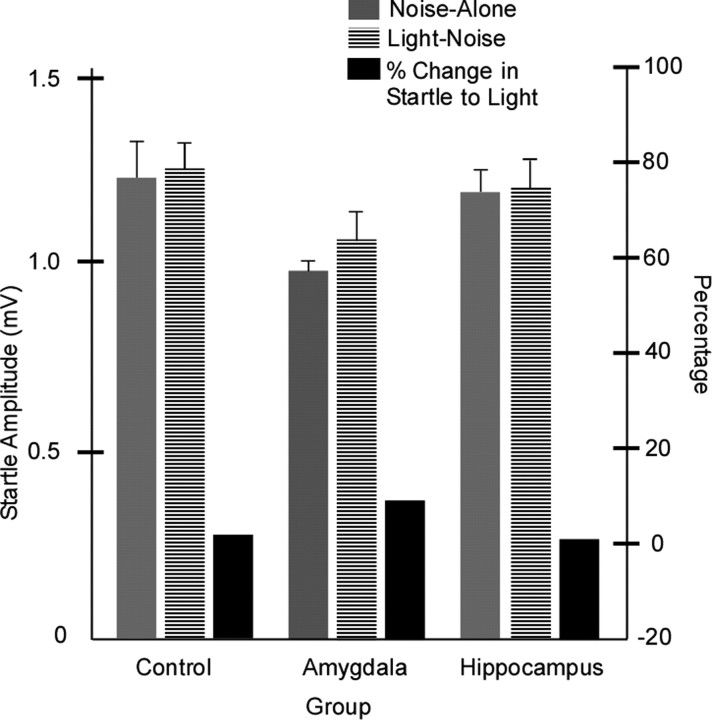
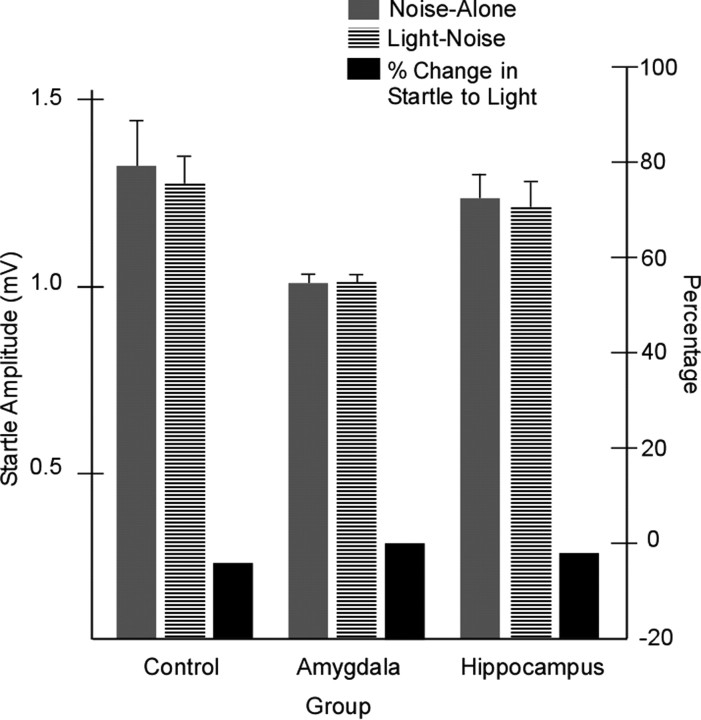
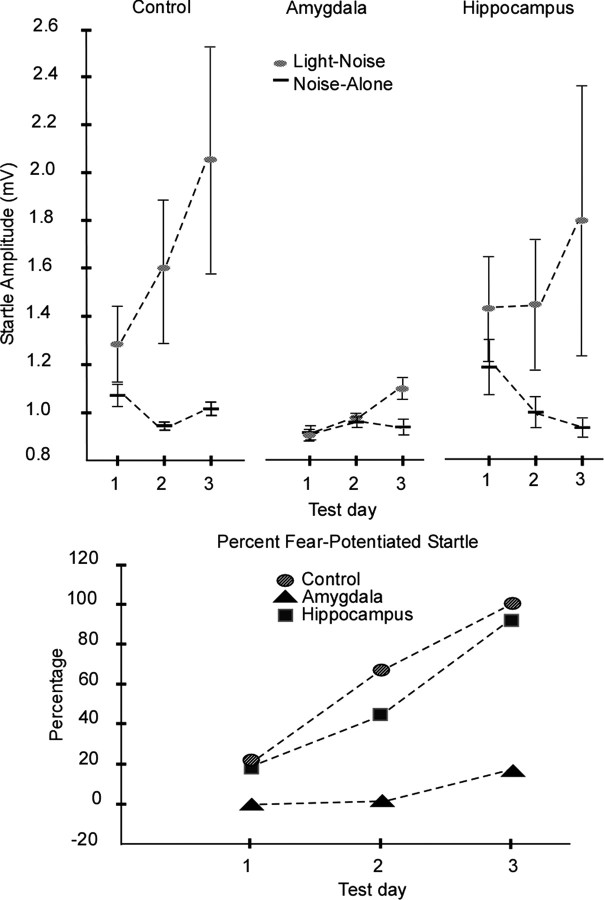
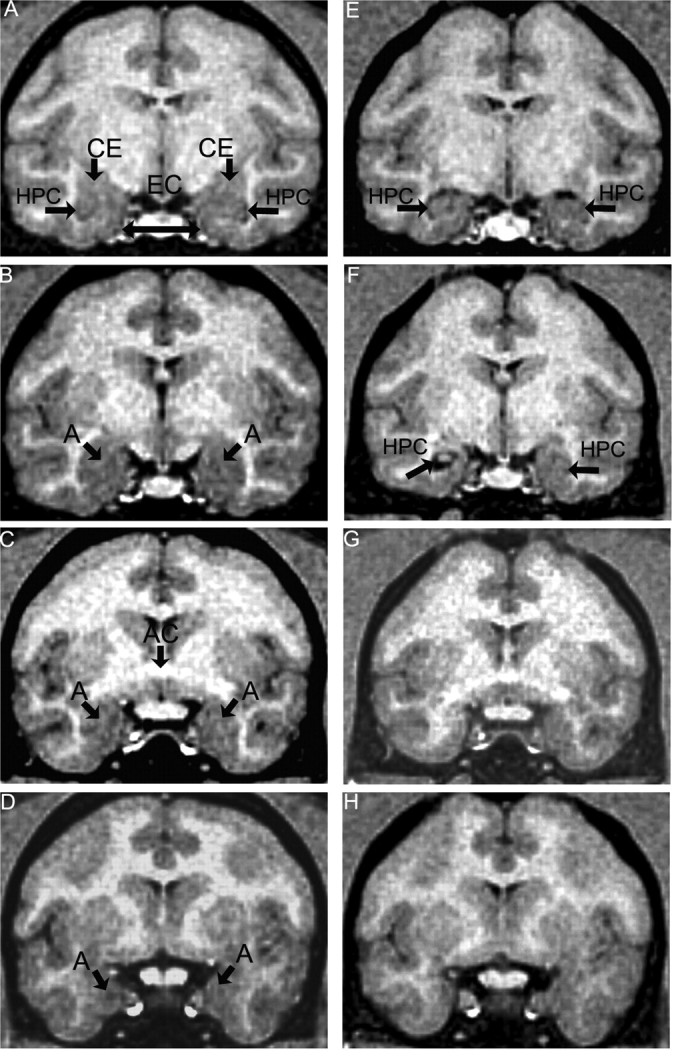
In experiment 1, we assessed the role of the primate amygdala and hippocampus in the acquisition of learned fear measured with fear-potentiated startle. Three groups of six rhesus monkeys were prepared with bilateral ibotenic acid lesions of the amygdaloid complex and the hippocampus or were sham operated. Selective ibotenic acid lesions of the amygdala, but not the hippocampus, blocked the acquisition of fear-potentiated startle. In experiment 2, we assessed the role of the primate amygdala in the expression of fear-potentiated startle. Surprisingly, animals that sustained amygdala damage after they successfully learned fear-potentiated startle expressed normal fear-potentiated startle, despite a complete amygdala lesion based on magnetic resonance imaging assessments. These results suggest that although the amygdala is necessary for the initial acquisition of fear-potentiated startle, it is not necessary for the retention and expression of fear-potentiated startle. These findings are discussed in relation to the role of the amygdala in emotional learning and in cross-species comparisons of emotional behavior.


Figures

Figure 1.
Figure 1.
A photograph of the fear-potentiated startle apparatus (Med Associates). Arrows point to the speaker assembly (a), to one of the four ceiling lights (b), and to the floor of the chair (c), which has adjustable levels for different monkey heights. The load cell/strain gauge (d) is located under the upper panel of the platform. The animal is transferred in a custom-built primate restraint chair that is positioned on the platform and secured with side wing nuts.
Figure 2.
Figure 2.
Photomicrographs of three levels [arranged from rostral to caudal (top to bottom)] through the amygdala in case MMU27695 (left) with the most complete and discrete amygdaloid lesion, an unlesioned monkey (center), and case MMU25729 (right) with the smallest lesion in the experimental group. Scale bar, 1 cm.
Figure 3.
Figure 3.
Higher-magnification photomicrographs of the left (A) and right (B) amygdala in the unlesioned monkey and images at the same left (C) and right (D) level in case MMU27695 with the most complete and discrete amygdaloid lesion. CL, Claustrum; AAA, anterior amygdaloid area; L, lateral nuclei; B, basal nuclei; AB, accessory basal nuclei; EC, entorhinal cortex; PR, presubiculum; sts, superior temporal sulcus; rs, rhinal sulcus; COa, anterior cortical nucleus; V, ventricle. Asterisks indicate some extraneous damage in the perirhinal cortex in the fundus of the rhinal sulcus. The arrow indicates sparing of dorsally placed superficial nuclei. Scale bar, 2 mm.
Figure 4.
Figure 4.
Mean startle amplitude as a function of stimulus intensity. Acoustic stimuli varied from 80 to 120 dB. Responses are shown for animals in the amygdala (n = 6) and hippocampus (n = 6) lesion groups as well as the control group (n = 6). Error bars at each data point denote SEM.
Figure 5.
Figure 5.
Mean startle amplitude to 110 dB startle stimuli in the absence (noise alone) or presence (light–noise) of a 4.2 s light during the light–response phase. Error bars denote SEM. Black bars illustrate the percentage change in startle produced by light presentation (right axis).
Figure 6.
Figure 6.
Mean startle amplitude to 110 dB startle stimuli in the absence (noise alone) or presence (light–noise) of a 4.2 s light during the light–response phase. Animals with >10% light-induced startle enhancement have been eliminated from this analysis (for rationale, see Results, Experiment 1, Phase II: light–response). Error bars denote SEM. Black bars illustrate the percentage change in startle produced by light presentation (right axis).
Figure 7.
Figure 7.
Top, Mean startle amplitude to 110 dB startle stimuli in the presence (circle) or absence (rectangle) of the 4.2 s light in the amygdala (n = 4) and hippocampus (n = 5) lesion groups as well as the control group (n = 5) during test days 1–3. Vertical bars at each data point denote SEM (bottom). The percentage change in startle produced by light presentation for the amygdala and hippocampus lesion groups as well as the control group during test days 1–3 is shown.
Figure 8.
Figure 8.
Preoperation (A–D) and postoperation (E–H) MR images in case MMU32097 with the most complete and discrete lesion to the amygdala. Presection and postsection are displayed in a caudal (top) to rostral (bottom) direction with a 2 mm intersection distance. The lesion produced a substantial distortion of the medial temporal lobe so other neuroanatomical landmarks were used to match the preoperation to the postoperation section series. The preoperation sections cover the full 7–8 mm rostrocaudal length of the amygdala. A, Arrows point to the central nucleus of the amygdala (CE), the entorhinal cortex (EC), and the hippocampus (HPC). B–D, The amygdala (A) is displayed in B–D, and the anterior commissure (AC) is displayed in C. All postoperative sections exhibit substantial shrinkage of the amygdala. E, F, The hippocampus (HPC) is prominent in the caudal areas where the central nucleus of the amygdala (CE) is normally found. G, H, The lesion has produced ventricular expansion, as shown in E, and there is enormous shrinkage of the amygdala in the rostral areas.
Figure 9.
Figure 9.
Mean startle amplitude as a function of stimulus intensity in all animals. Acoustic stimuli vary from 80 to 115 dB. Data are averaged across four daily sessions. Error bars at each data point denote SEM.
Figure 10.
Figure 10.
Mean startle amplitude to 100 dB startle stimuli in the absence (noise alone) or presence (light–noise) of a 4.2 s light during the light–response phase (left column) and the prelesion (middle column) and postlesion (right column) fear-potentiated startle testing phases. The gray and striped bars illustrate startle response magnitude (left axis). Error bars denote SEM. The black bars represent the percentage change in startle produced by light presentation (right axis) in all graphs.

Similar articles

Cited by

References

    1. Aggleton JP, Passingham RE. Syndrome produced by lesions of the amygdala in monkeys (Macaca mulatta) J Comp Physiol Psychol. 1981;95:961–977. - PubMed
    1. Amaral DG, Price JL, Pitkanen A, Carmichael T. Anatomical organization of the primate amygdaloid complex. In: Aggleton J, editor. The amygdala: neurobiological aspects of Emotion, memory, and mental dysfunction. New York: Wiley; 1992. pp. 1–66.
    1. Banta-Lavenex P, Amaral DG, Lavenex P. Hippocampal lesion prevents spatial relationship learning in adult macaque monkeys. J Neurosci. 2006;26:4546–4558. - PMC - PubMed
    1. Campeau S, Davis M. Involvement of the central nucleus and basolateral complex of the amygdala in fear conditioning measured with fear-potentiated startle in rats trained concurrently with auditory and visual conditioned stimuli. J Neurosci. 1995;15:2301–2311. - PMC - PubMed
    1. Cassella J, Davis M. Habituation, prepulse inhibition, fear conditioning, and drug modulation of the acoustically elicited pinna reflex in rats. Behav Neurosci. 1986;100:39–44. - PubMed

Publication types

LinkOut - more resources