. 2007 Jul 11;27(28):7418-28.
doi: 10.1523/JNEUROSCI.4540-06.2007.

Nuclear localization of ataxin-3 is required for the manifestation of symptoms in SCA3: in vivo evidence

Affiliations

Nuclear localization of ataxin-3 is required for the manifestation of symptoms in SCA3: in vivo evidence

Ulrike Bichelmeier et al. J Neurosci. .

Abstract

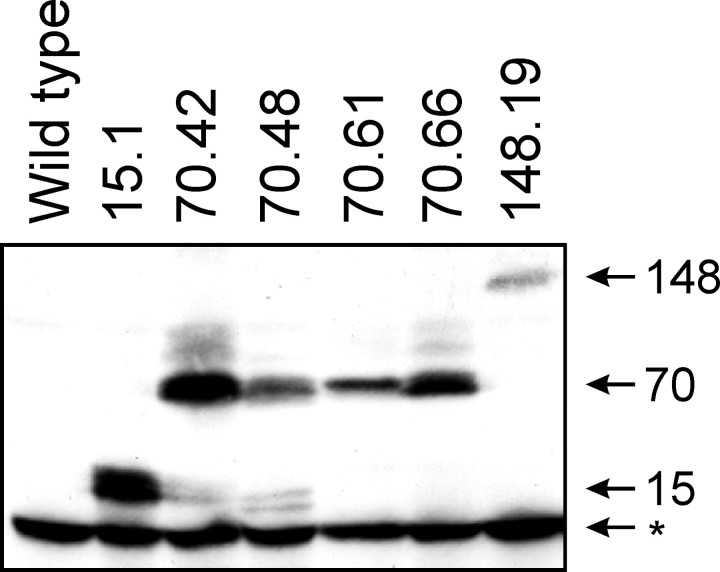
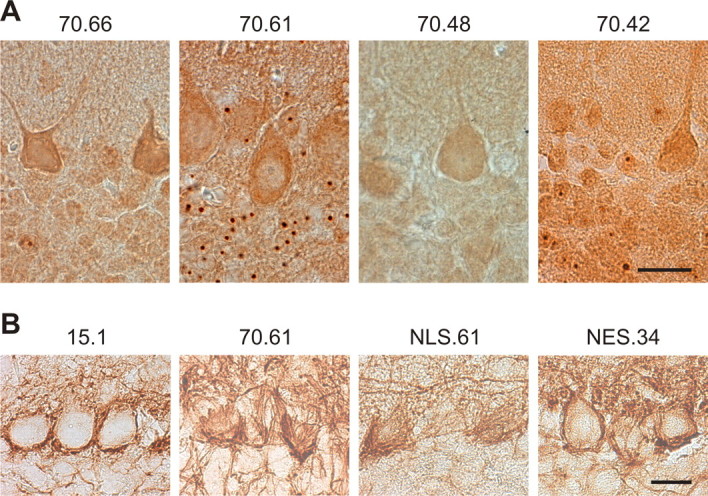
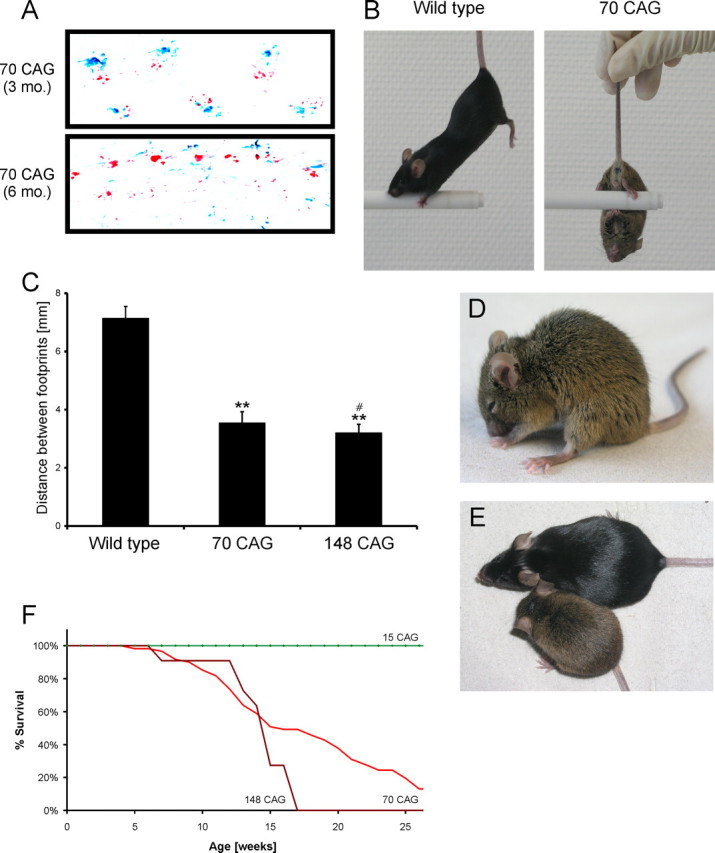
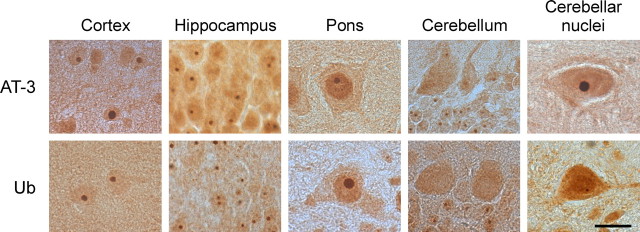
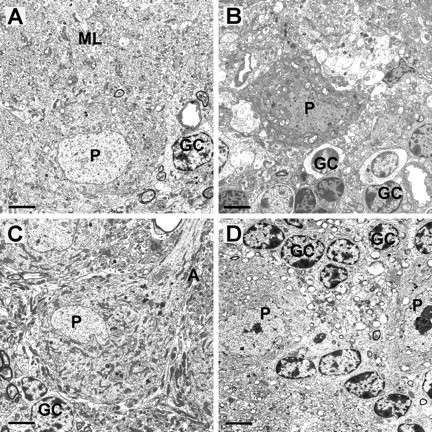
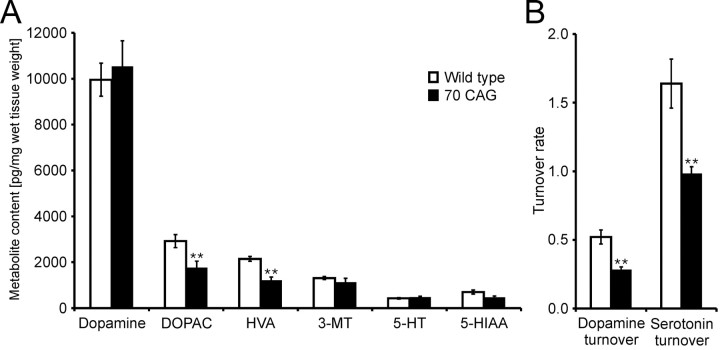
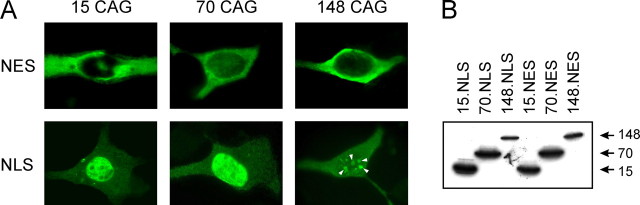
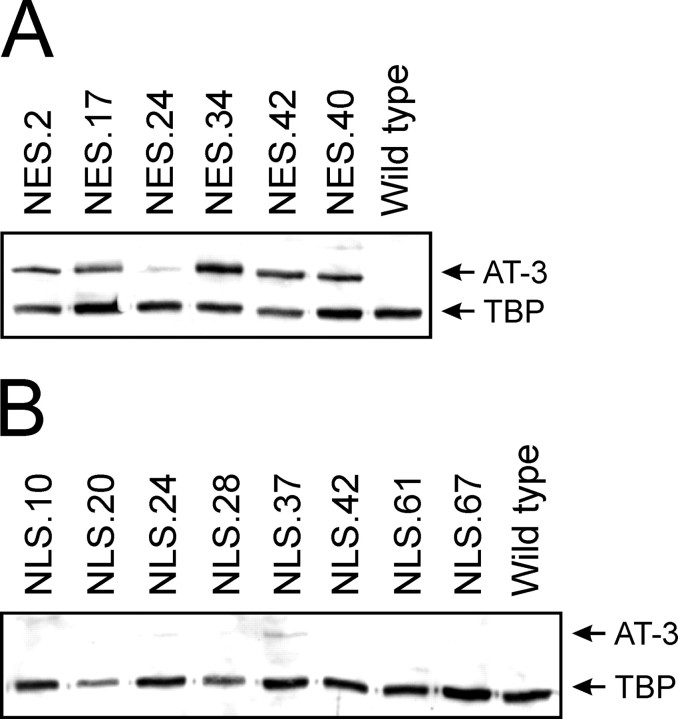
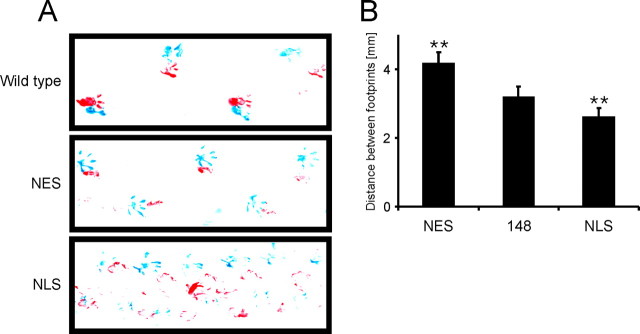
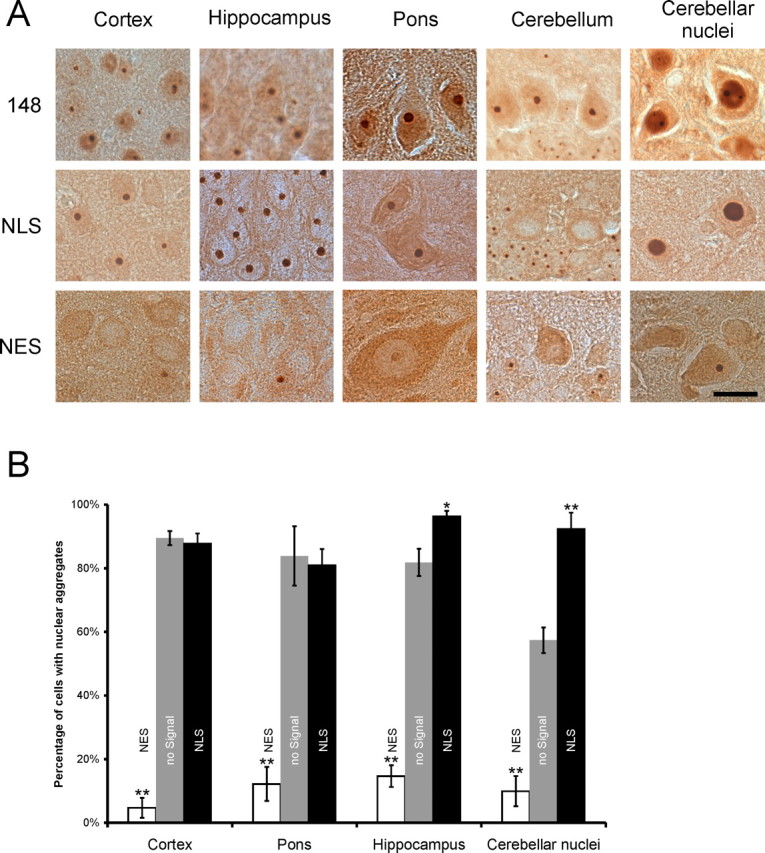
Spinocerebellar ataxia type 3 (SCA3) is an autosomal dominantly inherited neurodegenerative disorder caused by the expansion of a CAG repeat in the MJD1 gene resulting in an expanded polyglutamine repeat in the ataxin-3 protein. To study the course of the disease, we generated transgenic mice for SCA3 using full-length ataxin-3 constructs containing 15, 70, or 148 CAG repeats, respectively. Control mice (15 CAGs) were phenotypically normal and had no neuropathological findings. However, mice transgenic for ataxin-3 with expanded polyglutamine repeats were severely affected by a strong neurological phenotype with tremor, behavioral deficits, strongly reduced motor and exploratory activity, a hunchback, and premature death at 3 to 6 months of age. Neuropathological examination by immunohistochemical staining revealed ubiquitin- and ataxin-3-positive intranuclear inclusion bodies in a multitude of neurons. Directing ataxin-3 with 148 CAGs to the nucleus revealed an even more pronounced phenotype with more inclusions and earlier death, whereas mice transgenic with the same construct but attached to a nuclear export signal developed a milder phenotype with less inclusions. These studies indicate that nuclear localization of ataxin-3 is required for the manifestation of symptoms in SCA3 in vivo.


Figures

Figure 1.
Figure 1.
Expression of ataxin-3 constructs in different transgenic mouse lines. The Western blot analysis using an anti-ataxin-3 antibody (kindly provided by Peter Breuer, University of Bonn, Bonn, Germany) shows expression of ataxin-3 in whole brain extract of different transgenic SCA3 mouse lines containing an ataxin-3 construct with a variable number of CAG repeats (15, 70, and 148, respectively). The mouse lines are named after the transgene and the number of the line (e.g., line 61 of the mice with 70 CAG repeats is 70.61). Mice of the strongly affected lines (70.61 and 148.19) were analyzed at 3 months of age, of the other lines at 11 months of age. For comparison, brain extract of a wild-type mouse is shown. Arrows mark the ataxin-3 transgenes and the number of CAG repeats. Endogenous ataxin-3 is marked with an asterisk (*). Comparable analyses with additional anti-ataxin-3 antibodies confirmed the identity of the marked bands (data not shown). Low signal intensities in lines 70.61 and 148.19 reflect the reduced availability of soluble ataxin-3 caused by the formation of insoluble intranuclear aggregates.
Figure 2.
Figure 2.
Cerebellar sections of transgenic SCA3 mice. A, Cerebellar tissue from different mouse lines with 70 CAG repeats at 1 year of age (except for line 70.61, at 4 months of age) were stained with an anti-ataxin-3 antibody. Ataxin-3 aggregates in cells of the granular layer of the cerebellum are especially prominent in line 70.61. No inclusion bodies were identified in Purkinje cells. Scale bar, 20 μm. B, Cerebellar tissue from different SCA3 mice with 15 and 70 CAG repeats as well as with 148 CAG repeats supplemented with a NLS or NES signal, respectively, was stained with an anti-phosphorylated neurofilament antibody. The formation of contracted or empty baskets around Purkinje cells is apparent in the model with 70 CAG repeats. An increase of basket formation is also visible in the NLS model even if not so marked. The NES model appears to be almost unchanged, similarly to transgenic control mice (15 CAG repeats). Ages of the mice: 15 CAG and NES, 1 year; 70 CAG and NLS, 4 months. Scale bar, 20 μm.
Figure 3.
Figure 3.
Analysis of transgenic SCA3 mice. A, For gait analysis, forelimbs of mice were stained with red and hindlimbs with blue nontoxic paint. The gait of the young mouse with 70 CAG repeats (line 70.61) at 3 months of age is already slightly affected (see the minced gate), but the mouse is still able to walk. In the mouse at the end stage of the disease (6 months), the gate deteriorated and the mouse is almost incapable of walking. B, The severe phenotype of transgenic SCA3 mice is conspicuous in the pen test. Control mice approaching a pen or rod from above grab for it and start walking on the pen. SCA3 mice (line 70.61, shown at 6 months of age), however, are not able to perform this task exhibiting a so-called clasping behavior. This test clearly demonstrates the disturbance of motor coordination caused by the expression of the expanded ataxin-3 transgenes. C, Statistical analysis of footprint pattern revealed a significant decrease of the distance between each step in mice carrying 70 CAG repeats compared with wild-type mice. The distance between each step is even more significantly reduced in mice with the 148 CAG repeat transgene (**p < 0.001). In addition, mice with 148 CAG (age, 10 weeks) perform significantly weaker than mice with 70 CAG repeats at 12 weeks of age (#p < 0.001). D, Transgenic SCA3 mouse carrying 70 CAG repeats (line 70.61). The wide-based hindlimbs, the hunchback, inactivity, and the disheveled appearance caused by reduced grooming are apparent. E, Mice transgenic for ataxin-3 with 70 CAG repeats (the brown mouse) are significantly smaller than their negative littermates at the same age (black mouse). The difference in body size is also reflected in body weight. F, Survival of transgenic SCA3 mice containing expanded CAG repeats as well as control mice (15 CAG repeats) was observed for >6 months. Only 50% of the SCA3 mice with 70 CAG repeats (line 70.61) survived for 4 months. After a period of 6 months, >85% of these mice were dead, whereas no control mouse with 15 CAG repeats had died. The fact is even more apparent in mice carrying 148 CAG repeats (line 148.19): these mice die even earlier, and no mouse of this model survived >17 weeks. For each line, between 11 and 61 mice were included in this analysis.
Figure 4.
Figure 4.
Expression of the expanded ataxin-3 transgene in different tissues. Tissue from different brain regions (cortex, hippocampus, pons, and cerebellum) of SCA3 transgenic mice with 70 CAG repeats (line 70.61) at 3 months of age was stained immunohistochemically using antibodies against ataxin-3 (AT-3) and ubiquitin (Ub). In all examples, the large number of inclusion bodies is apparent. The inclusion bodies contain both ataxin-3 and ubiquitin. Scale bar, 20 μm.
Figure 5.
Figure 5.
Electron microscopy of the cerebellum of transgenic SCA3 mice. A, Ultrathin section of the cerebellum of a control mouse with 15 CAG repeats at 3 months of age with overall normal findings: the Purkinje cell is characterized by a more or less round nucleus with granular chromatin and a high amount of rough endoplasmic reticulum. The molecular layer (ML) is formed of densely meshed axonal and dendritic neuronal as well as glial processes, and the extracellular space is small. The granule cells (GC) have smaller nuclei than Purkinje cells (P); however, the ratio between nucleus and cytoplasm is larger in granule cells compared with Purkinje cells. B, Ultrathin section of the cerebellum of a transgenic SCA3 mouse with 70 CAG repeats (line 70.61, 3 months of age). The striking pathological feature is the conspicuous shrinking of the Purkinje cells. The increase in the electron density of the cytoplasm and the karyoplasm and the irregular alteration of the cytoplasmic and nuclear shape is apparent. The granule cells (GC) appear to be normal in this mouse. C, Ultrathin section of the cerebellum of the NES mouse model (line NES.42, 11 months of age). In this tissue, we were not able to identify pathological alterations, neither in granule cells nor in Purkinje cells. The molecular layer was unaltered. D, Ultrathin section of the cerebellum of the NLS mouse model (line NLS.28, 11 months of age). The GCs mainly grouped around Purkinje cells appear to be normal. The Ps appear slightly shrunken and the nuclei slightly indented. However, these alterations are not as prominent as in the model without localization signals (Fig. 5B). A, Astrocyte. Scale bars, 5 μm.
Figure 6.
Figure 6.
Content of neurotransmitters and their metabolites in SCA3 transgenic mice (line 70.61) and controls. A, The content of neurotransmitters was determined using HPLC and is presented in picograms of substance per 1 mg of wet tissue. Each data point represents the mean (±SEM) of five male mice at 3 months of age. In mice transgenic for ataxin-3 with 70 CAG repeats, the content of both DOPAC (p < 0.05) and HVA (p < 0.005) was significantly reduced. B, Dopamine and serotonin turnover rates were calculated according to Masilamoni et al. (2005). The turnover rates of both dopamine (p < 0.005) and serotonin (p < 0.05) were significantly reduced in our SCA3 mouse model. 3-MT, 3-Methoxytyramine. Dopamine turnover = (DOPAC + HVA)/dopamine. Serotonin turnover = (5-HIAA/5-HT).
Figure 7.
Figure 7.
Analysis of ataxin-3 constructs containing nuclear localization signals in tissue culture. A, Ataxin-3 constructs with 15, 70, or 148 CAG repeats and attached NLS or NES were transfected in human embryonic kidney 293 (HEK-293) cells. The NES targets the expression of the transgene to the cytoplasm, whereas the NLS leads to an almost exclusive expression of the transgene in the nucleus. When using the construct with 148 CAG repeats, inclusion bodies could be observed in some transfected cells. In this case, the whole nuclear staining was concentrated to the aggregates (see arrowheads). B, Western blot analysis of transfected HEK-293 cells confirmed the expression of all analyzed ataxin-3 constructs (with 15, 70, and 148 CAG repeats), with both nuclear localization and nuclear export signal.
Figure 8.
Figure 8.
Comparison of transgenic mouse lines containing NLS or NES-tagged ataxin-3 (AT-3) with 148 CAG repeats. Brains of transgenic mice were lysed, and the proteins were analyzed by Western blotting using the 1C2 antibody against expanded polyglutamine repeats. A, B, Whereas the transgene is detectable in mice carrying an NES (A; AT-3), only a very faint band is visible in mice carrying an NLS (B), possibly because of the fact that all of the protein is recruited to protein aggregates. TBP marks the TATA binding protein, which is codetected when using the 1C2 antibody, because TBP was used for the generation of the antibody. Ages of analyzed mice: up to 5 months (NES.2, NES.17, NES.24, NES.34, NES.42, NLS.10, NLS.20, NLS.24, NLS.28, and NLS.37) and 7 months (NES.40, NLS.42, NLS.61, and NLS.67). Age differs because affected founders generating no offspring were kept until the end stage of the disease.
Figure 9.
Figure 9.
Footprint pattern of transgenic mice containing ataxin-3 with 148 CAG repeats supplemented with either an NES or NLS compared with a wild-type mouse. A, The clear differences in footprint pattern are apparent. Compared with the wild-type mouse, the distance between each step is reduced in the NES mouse (line NES.24, 11 months), and the mouse is walking on tiptoe but is still able to walk. The gait of the NLS mouse (line NLS.10) at the same age, however, is severely affected, and the difficulty of this mouse to walk is apparent. B, The footprint patterns were compared and measured for the distance between each step. A reduced distance of footprints reflects a minced gait. This disturbance is significantly reduced by the NES (p < 0.001) and significantly enhanced by the NLS (p < 0.001), resulting in an extended and reduced distance between each step, respectively. Shown is the mean of all available respective mouse lines at 10–12 months of age.
Figure 10.
Figure 10.
Nuclear export of expanded ataxin-3 prevents the formation of intranuclear inclusion bodies. A, Brains of mice transgenic for ataxin-3 constructs containing 148 CAG repeats were analyzed immunohistochemically using an anti-ataxin-3 antibody for the formation of intranuclear inclusion bodies. The transgene is tagged either with or without nuclear localization or export signals. In contrast to the two other mouse lines, an essentially reduced number of intranuclear inclusion bodies have been identified in mice containing an ataxin-3 construct supplemented with a nuclear export signal. The nuclear localization signal increases the number of inclusion bodies. Scale bar, 20 μm. B, For each construct (with or without a localization signal; NLS or NES), one exemplary mouse line was analyzed for the percentage of neurons containing inclusion bodies. Four brain regions (pons, cerebellar nuclei, hippocampus, and cortex) were compared. The presented data reflect the mean of up to 10 randomly selected fields of vision for each mouse line and brain region. A significant increase of the number of inclusion bodies can be observed in the hippocampus (*p < 0.01) and in the cerebellar nuclei (**p < 0.001) of mice with NLS, whereas the NES dramatically reduces the number of inclusion bodies (**p < 0.001). A, B, Data for line NLS.37 at 4 months of age and line NES.17 at 5 months of age, respectively.

Similar articles

Cited by

References

    1. Albrecht M, Golatta M, Wüllner U, Lengauer T. Structural and functional analysis of ataxin-2 and ataxin-3. Eur J Biochem. 2004;271:3155–3170. - PubMed
    1. Baybutt H, Manson J. Characterisation of two promoters for prion protein (PrP) gene expression in neuronal cells. Gene. 1997;184:125–131. - PubMed
    1. Benn CL, Landles C, Li H, Strand AD, Woodman B, Sathasivam K, Li SH, Ghazi-Noori S, Hockly E, Faruque SM, Cha JH, Sharpe PT, Olson JM, Li XJ, Bates GP. Contribution of nuclear and extranuclear polyQ to neurological phenotypes in mouse models of Huntington's disease. Hum Mol Genet. 2005;14:3065–3078. - PubMed
    1. Bjorkqvist M, Fex M, Renstrom E, Wierup N, Petersen A, Gil J, Bacos K, Popovic N, Li JY, Sundler F, Brundin P, Mulder H. The R6/2 transgenic mouse model of Huntington's disease develops diabetes due to deficient beta-cell mass and exocytosis. Hum Mol Genet. 2005;14:565–574. - PubMed
    1. Bradford MM. A rapid and sensitive method for the quantitation of microgram quantities of protein utilizing the principle of protein-dye binding. Anal Biochem. 1976;72:248–254. - PubMed

Publication types

MeSH terms