. 2007 Jul 11;27(28):7508-19.
doi: 10.1523/JNEUROSCI.0705-07.2007.

Postsynaptic ephrinB3 promotes shaft glutamatergic synapse formation

Affiliations

Postsynaptic ephrinB3 promotes shaft glutamatergic synapse formation

Jason Aoto et al. J Neurosci. .

Abstract

Excitatory synapses in the CNS are formed on both dendritic spines and shafts. Recent studies show that the density of shaft synapses may be independently regulated by behavioral learning and the induction of synaptic plasticity, suggesting that distinct mechanisms are involved in regulating these two types of synapses. Although the molecular mechanisms underlying spinogenesis and spine synapse formation are being delineated, those regulating shaft synapses are still unknown. Here, we show that postsynaptic ephrinB3 expression promotes the formation of glutamatergic synapses specifically on the shafts, not on spines. Reducing or increasing postsynaptic ephrinB3 expression selectively decreases or increases shaft synapse density, respectively. In the ephrinB3 knock-out mouse, although spine synapses are normal, shaft synapse formation is reduced in the hippocampus. Overexpression of glutamate receptor-interacting protein 1 (GRIP1) rescues ephrinB3 knockdown phenotype by restoring shaft synapse density. GRIP1 knockdown prevents the increase in shaft synapse density induced by ephrinB3 overexpression. Together, our results reveal a novel mechanism for independent modulation of shaft synapses through ephrinB3 reverse signaling.


Figures

Figure 1.
Figure 1.
Expression of ephrinB3 in HEK293 cells clusters glutamate synaptic vesicles. A, The ephrinB3- or GFP-expressing HEK293 cells were cocultured with 10–12 DIV hippocampal neurons for 2 d. VGluT1 staining revealed formation of glutamatergic presynaptic terminals in axons crossing HEK293 cells expressing ephrinB3, but not those expressing GFP. Axons are highlighted by arrows in the differential interference contrast pictures. Scale bar, 10 μm. B, Number of VGluT1 puncta in axons crossing ephrinB3-expressing HEK293 cells was greater than in those that contact GFP-expressing HEK293 cells (ephrinB3, n = 17; GFP, n = 33; *p < 1 × 10⁻¹⁰). No significant increase in GAD65 clustering was induced by ephrinB3 (ephrinB3, n = 17; GFP, n = 22; p > 0.5). C, The VGluT1 interpuncta distance was significantly larger in axons contacting GFP-expressing HEK293 cells compared with ephrinB3-expressing cells (p < 0.05). D, E, Total area and integrated intensity of VGluT1 puncta for axons contacting ephrinB3-expressing HEK293 cells were greater than those crossing GFP-expressing cells (ephrinB3, n = 17; GFP, n = 33; *p < 1 × 10⁻⁶). No significant change in GAD65 signal was induced by ephrinB3 expression (ephrinB3, n = 17; GFP, n = 22; p > 0.5). All error bars indicate SEM.
Figure 2.
Figure 2.
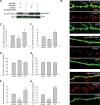
Selective modulation of shaft synapses by ephrinB3. A, Efficiency and specificity of ephrinB3-siRNA. HEK293 cells were transfected with pSuper empty vector or pSuper-based construct targeting rat ephrinB3, together with cDNAs expressing CFP-ephrinB3 or CFP-ephrinB2, and were immunoblotted for CFP with a GFP antibody. The bands found at ∼60 kDa represent CFP-tagged ephrinBs. GFP expression (the 26 kDa band) driven by a second promoter in pSuper vector was used as the loading control. B, Excitatory (VGluT1-positive) synapse density was increased by postsynaptic ephrinB3 overexpression, and reduced by eprhinB3 knockdown. Scale bar, 10 μm. C–E, Synapse density quantified with the excitatory presynaptic marker VGluT1. C, Total VGluT1 density on dendrites of pSuper-, ephrinB3-siRNA, or ephrinB3-transfected (OE, overexpression) neurons. RNAi significantly reduced excitatory synapse density, whereas ephrinB3 overexpression increased it (pSuper, n = 18 cells; RNAi, n = 18 cells; OE, n = 22 cells; 3 branches/cell; *p < 1 × 10⁻⁵). D, EphrinB3 knockdown slightly increased spine VGluT1 density (p = 0.04), and ephrinB3 overexpression had no effect on VGluT1 density (p > 0.6). E, The density of VGluT1 puncta that were on the shaft were dramatically reduced by RNAi of ephrinB3, and increased by postsynaptic ephrinB3 overexpression (*p < 0.005). F–H, Synapse density quantified with excitatory postsynaptic marker PSD-95. F, Similar to results obtained with VGluT1 staining, total PSD-95 puncta density was reduced by ephrinB3-siRNA and increased by ephrinB3 overexpression (n = 15 cells per group; 3 branches/cell; *p < 0.05). G, PSD-95 density in spines was not affected (p > 0.5). H, PSD-95 density in shafts was greatly reduced by ephrinB3-siRNA (p < 10−12) and increased by ephrinB3 overexpression (p < 0.0005). All error bars indicate SEM.
Figure 3.
Figure 3.
Excitatory synapses in the CA1 region of the ephrinB3-null mouse. A, B, Examples of micrographs taken at low magnification (A, 15,000×) or high magnification (B, 30,000×) from wild-type and ephrinB3−/− mice. Synaptic junctions with a postsynaptic density (arrows) are identified as excitatory synapses. Scale bars: A, 1 μm; B, 200 nm. C, Examples of excitatory synapses formed on dendritic shafts (*) and spines (s). Den, Dendrite; s, spine. Scale bar, 200 nm.
Figure 4.
Figure 4.
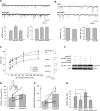
Postsynaptic ephrinB3 expression increases excitatory synaptic function. A, EphrinB3 overexpression for 1 d increased mEPSC frequency (n = 26 for each group; *p < 0.01) but not their amplitude (p > 0.1). EphB2 overexpression did not affect excitatory synaptic transmission (n = 29; frequency, p > 0.5; amplitude, p > 0.09). B, Overexpression of ephrinB3 did not affect frequency or amplitude of mIPSCs (GFP, n = 25; ephrinB3, n = 22; frequency, p > 0.1; amplitude, p > 0.5). C, The PPRs of evoked responses (R2/R1) at various intervals were measured between two synaptically connected hippocampal neurons with paired whole-cell patch-clamp recording. Increasing external calcium concentration significantly reduced PPR (control, n = 14; high Ca2+, n = 9; *p < 0.005). Postsynaptic expression of ephrinB3 did not significantly change the PPR (n = 14; p > 0.5). Representative traces (average from 5 trials) under each recording condition are shown at the right. D, E, Direct comparison of presynaptic release properties in a triplet mode. D, The schematic on top depicts the triplet-recording mode in which two postsynaptic cells, one untransfected and the other overexpressing ephrinB3, share one presynaptic neuron. Postsynaptic ephrinB3 overexpression did not cause reduction in the PPR (n = 8 triplet pairs; p > 0.1, paired t test). E, However, a significant increase in evoked response amplitude was induced by ephrinB3 overexpression (*p < 0.05, paired t test). F, Two CFP-ephrinB3 constructs, one full-length bearing a silent mutation (ephrinB3*) and the other with a PDZ-binding domain deletion (ephrinB3*-ΔPDZ), are resistant to ephrinB3-siRNA. G, AMPA receptor-mediated mEPSC frequency was reduced by ephrinB3 knockdown (pSuper, n = 24; siRNA, n = 30; **p < 1 × 10⁻⁴). This reduction was fully rescued by coexpression of the mutant full-length ephrinB3* (n = 30; *p < 0.01), but not by coexpression of the ephrinB3*-ΔPDZ (n = 26; # p > 0.5). All error bars indicate SEM.
Figure 5.
Figure 5.
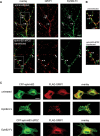
GRIP1 coclusters with ephrinB3. A, Clustering of GRIP1 by EphB2-Fc in neuronal dendrites. Untransfected or ephrinB3-ΔPDZ-transfected neurons were incubated with EphB2-Fc that was preclustered with a FITC-conjugated secondary antibody against human Fc, fixed, and immunostained for GRIP1. In untransfected neurons (top panels), large clusters of GRIP1 and EphB2-Fc were colocalized (arrows). In ephrinB3-ΔPDZ-transfected neurons (bottom panels), clusters of GRIP1 (double arrowheads) and EphB2-Fc (single arrowheads) are not colocalized. Scale bar, 10 μm. B, Regions in the dashed rectangular box in A is shown at higher magnification. C, Coclustering of ephrinB3 and GRIP1 after EphB2 binding in HEK293 cells. HEK293 cells transiently expressing FLAG-GRIP1 and CFP-ephrinB3 were treated with EphB2-Fc before fixation and immunostaining. In untreated cells, the ephrinB3 signal was mostly diffuse and GRIP1 was found in small clusters. After EphB2-Fc treatment, ephrinB3 became highly clustered with GRIP1 in large membrane patches in ephrinB3-expressing cells, but not in ephrinB3-ΔPDZ-expressing cells. Scale bar, 10 μm.
Figure 6.
Figure 6.
EphrinB3 expression regulates GRIP1 distribution in neurons. A, EphrinB3 influences the relative distributions of GRIP1 between dendritic shaft and spines. We separately quantified the intensities of GRIP1 signal from 100–150 μm stretches of dendritic shafts and from all individual spines along the same stretches of dendrites. Overexpression of ephrinB3 reduced the spine/shaft ratio of GRIP1 signal intensity, whereas ephrinB3 knockdown with ephrinB3-siRNA increased it (n = 10 cells for each group; 2–3 dendritic branches per cell; *p < 0.01; **p < 0.005). B, C, EphrinB3 directs GRIP1 to shaft glutamatergic synapses. Colocalization of VGluT1 and GRIP1 in both dendritic shafts and spines was measured. Manipulation of ephrinB3 expression levels did not change the proportion of shaft glutamatergic synapses that were GRIP1 positive (n = 15 cells per group; 2–3 branches/cell; p > 0.5). However, the number of spine synapses that were positive for GRIP1 was significantly increased by ephrinB3-siRNA (*p < 0.05). Arrows, GRIP1-positive synapses; arrowheads, GRIP1-negative synapses. Scale bars, 10 μm. All error bars indicate SEM.
Figure 7.
Figure 7.
GRIP1 in critically involved in ephrinB3-mediated shaft synapse formation. A, GRIP1 overexpression restored mEPSC frequency reduced by ephrinB3-siRNA. GRIP1 overexpression alone did not affect mEPSC frequency (pSuper, n = 23; GRIP1 alone, n = 20; ephrinB3-siRNA, n = 10; ephrinB3-siRNA+GRIP1, n = 30; *p < 0.01; **p < 0.005). B, Efficacy of GRIP1-siRNA. GRIP1 was coexpressed with pSuper empty vector or pSuper-GRIP1-siRNA in HEK293 cells. GFP expression by pSuper was used as a loading control. C, Effects of GRIP1 knockdown on ephrinB3-induced increase in mEPSC frequency. GRIP1-siRNA alone slightly reduced mEPSC frequency (pSuper, n = 11; GRIP1-siRNA, n = 19; p = 0.08). Coexpression of GRIP1-siRNA with ephrinB3 prevented the mEPSC increase by ephrinB3 overexpression (ephrinB3, n = 12; GRIP1-siRNA+ephrinB3, n = 28; *p < 0.05; **p < 0.005). D–G, GRIP1 and shaft synapse formation. Shaft and spine synapse density was quantified with VGluT1 staining. Scale bar, 5 μm. E, The reduction of total synapse density caused by ephrinB3-siRNA was fully restored by GRIP1 overexpression (n = 10 cells per group; 3 branches/cell; *p < 10−5; **p < 10−8). GRIP1-siRNA completely prevented the increase in synapse density by ephrinB3 overexpression (n = 10 cells per group; 3 branches/cell; # p > 0.4). F, Spine synapse density was not affected significantly by any of the manipulations. G, The reduction of total synapse density caused by ephrinB3-siRNA was fully restored by GRIP1 overexpression (*p < 10−12; **p < 10−18). GRIP1-siRNA completely prevented the increase in synapse density by ephrinB3 overexpression (# p > 0.7). All error bars indicate SEM.
Figure 8.
Figure 8.
A model for postsynaptic ephrinB3-mediated shaft synapse formation. For detailed explanations of A–E, see Discussion.

Similar articles

Cited by

References

    1. Anderson JC, Martin KA. Synaptic connection from cortical area V4 to V2 in macaque monkey. J Comp Neurol. 2006;495:709–721. - PubMed
    1. Armstrong JN, Saganich MJ, Xu NJ, Henkemeyer M, Heinemann SF, Contractor A. B-ephrin reverse signaling is required for NMDA-independent long-term potentiation of mossy fibers in the hippocampus. J Neurosci. 2006;26:3474–3481. - PMC - PubMed
    1. Biederer T, Sara Y, Mozhayeva M, Atasoy D, Liu X, Kavalali ET, Sudhof TC. SynCAM, a synaptic adhesion molecule that drives synapse assembly. Science. 2002;297:1525–1531. - PubMed
    1. Boyer C, Schikorski T, Stevens CF. Comparison of hippocampal dendritic spines in culture and in brain. J Neurosci. 1998;18:5294–5300. - PMC - PubMed
    1. Bozhilova-Pastirova A, Ovtscharoff W. Structure of the synaptic junctions in the rat sensorimotor cortex. Freeze-etching study of axodendritic synapses. Eur J Morphol. 1996;34:363–373. - PubMed

Publication types

MeSH terms

LinkOut - more resources