

Mathematical model developed for environmental samples: prediction of GC/MS dioxin TEQ from XDS-CALUX bioassay data
- PMID: 17626436
- PMCID: PMC2877589
- DOI: 10.1021/es062602+
Mathematical model developed for environmental samples: prediction of GC/MS dioxin TEQ from XDS-CALUX bioassay data
Abstract
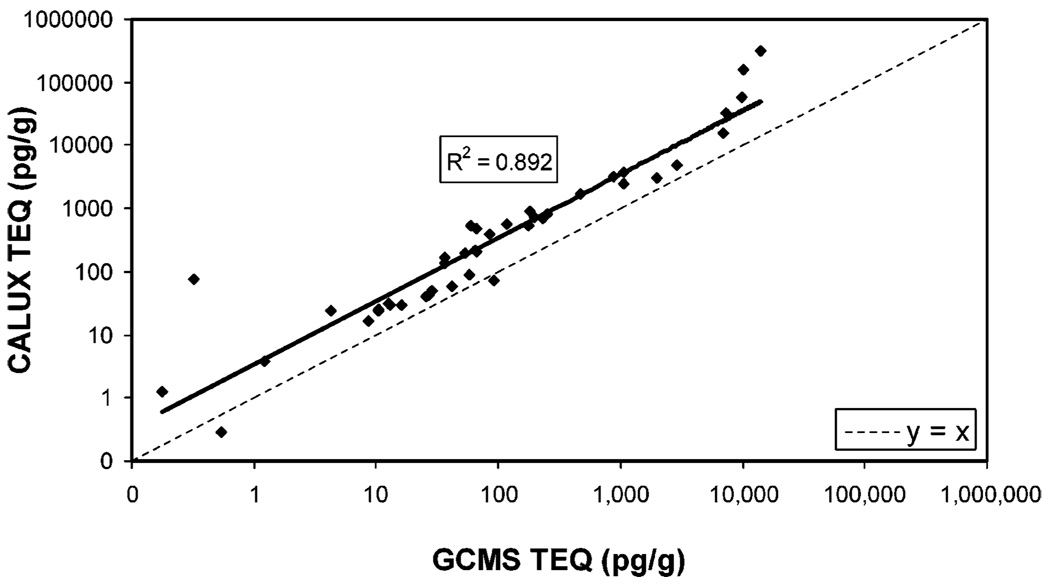
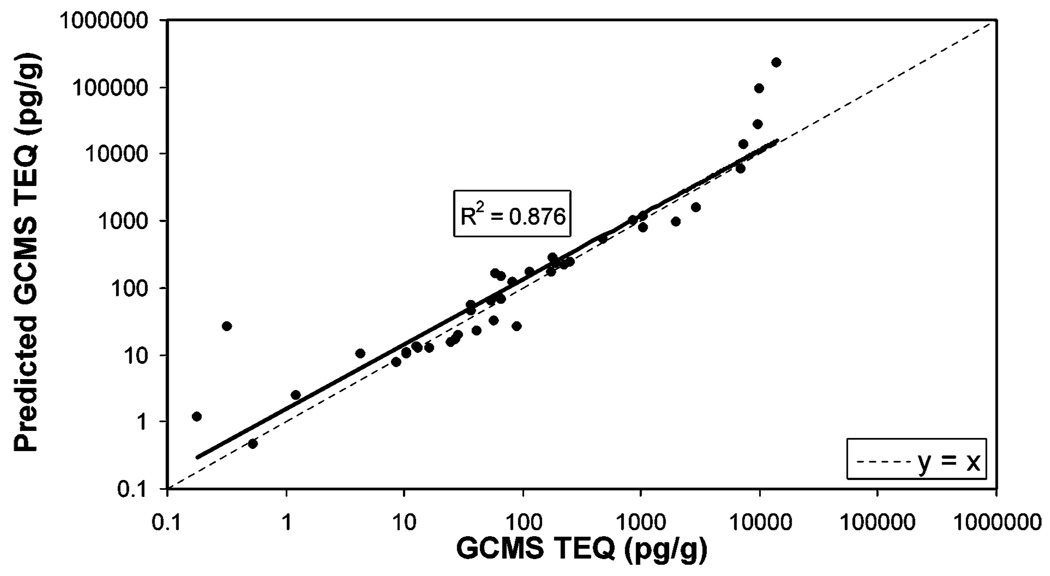
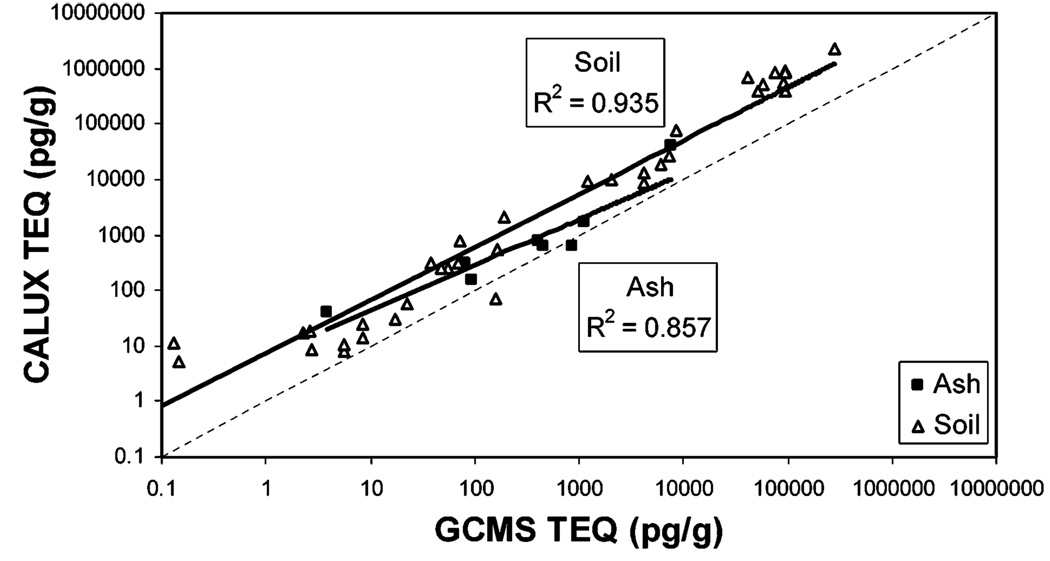
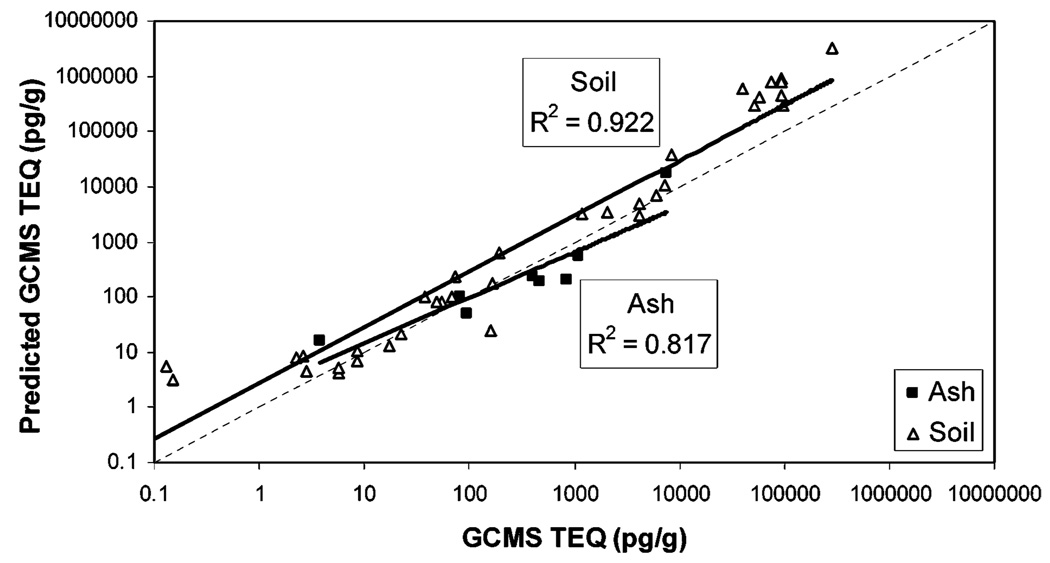
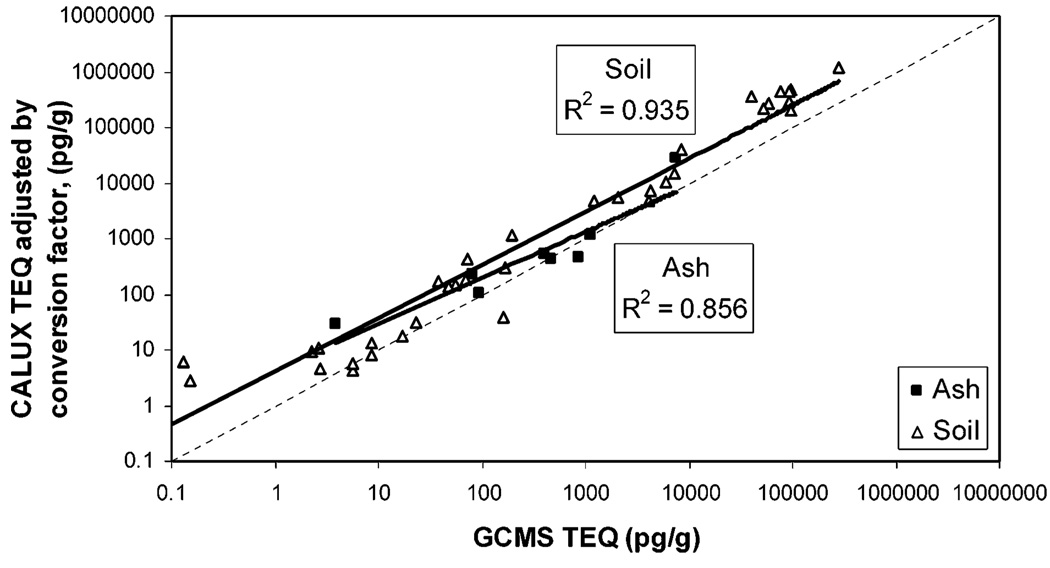
Remediation of hazardous waste sites requires efficient and cost-effective methods to assess the extent of contamination by toxic substances including dioxin-like chemicals. Traditionally, dioxin-like contamination has been assessed by gas chromatography/high-resolution mass spectrometry (GC/MS) analysis for specific polychlorinated dibenzo-p-dioxins, dibenzofurans, and biphenyl congeners. Toxic equivalency factors for these congeners are then used to estimate the overall dioxin toxic equivalency (TEQ) of complex mixtures found in samples. The XDS-CALUX bioassay estimates contamination by dioxin-like chemicals in a sample extract by measuring expression of a sensitive reporter gene in genetically engineered cells. The output of the XDS-CALUX assay is a CALUX-TEQ value, calibrated based on TCDD standards. Soil samples taken from a variety of hazardous waste sites were measured using the XDS-CALUX bioassay and GC/MS. TEQ and CALUX-TEQ from these methods were compared, and a mathematical model was developed describing the relationship between these two data sets: log(TEQ) = 0.654 x log(CALUX-TEQ) + 0.058-(log(CALUX-TEQ))2. Applying this equation to these samples showed that predicted and GC/MS measured TEQ values strongly correlate (R2 = 0.876) and that TEQ values predicted from CALUX-TEQ were on average nearly identical to the GC/MS-TEQ. The ability of XDS-CALUX bioassay data to predict GC/MS-derived TEQ data should make this procedure useful in risk assessment and management decisions.
Figures
Similar articles
-
DRE-CALUX bioassay in comparison with HRGC/MS for measurement of toxic equivalence in environmental samples.Sci Total Environ. 2007 Jan 1;372(2-3):657-67. doi: 10.1016/j.scitotenv.2006.10.036. Epub 2006 Dec 5. Sci Total Environ. 2007. PMID: 17156822
-
The use of the DR CALUX bioassay and indicator polychlorinated biphenyls for screening of elevated levels of dioxins and dioxin-like polychlorinated biphenyls in eel.Mol Nutr Food Res. 2006 Oct;50(10):945-57. doi: 10.1002/mnfr.200600061. Mol Nutr Food Res. 2006. PMID: 17009214
-
Validation and use of the CALUX-bioassay for the determination of dioxins and PCBs in bovine milk.Food Addit Contam. 1998 Nov-Dec;15(8):863-75. doi: 10.1080/02652039809374723. Food Addit Contam. 1998. PMID: 10366995
-
Integrated biomonitoring of dioxin-like compounds for waste management and environment.Ind Health. 2003 Jul;41(3):205-14. doi: 10.2486/indhealth.41.205. Ind Health. 2003. PMID: 12916751 Review.
-
Chemically activated luciferase gene expression (CALUX) cell bioassay analysis for the estimation of dioxin-like activity: critical parameters of the CALUX procedure that impact assay results.Environ Sci Technol. 2005 Oct 1;39(19):7357-64. doi: 10.1021/es0504993. Environ Sci Technol. 2005. PMID: 16245802 Review.
Cited by
-
Development of Species-Specific Ah Receptor-Responsive Third Generation CALUX Cell Lines with Enhanced Responsiveness and Improved Detection Limits.Environ Sci Technol. 2015 Oct 6;49(19):11903-12. doi: 10.1021/acs.est.5b02906. Epub 2015 Sep 24. Environ Sci Technol. 2015. PMID: 26366531 Free PMC article.
-
Combination of a fast cleanup procedure and a DR-CALUX® bioassay for dioxin surveillance in Taiwanese soils.Int J Environ Res Public Health. 2014 May 6;11(5):4886-904. doi: 10.3390/ijerph110504886. Int J Environ Res Public Health. 2014. PMID: 24806195 Free PMC article.
-
Enhancing the response of CALUX and CAFLUX cell bioassays for quantitative detection of dioxin-like compounds.Sci China Chem. 2010 May;53(5):1010-1016. doi: 10.1007/s11426-010-0142-8. Sci China Chem. 2010. PMID: 21394221 Free PMC article.
-
Third-generation Ah receptor-responsive luciferase reporter plasmids: amplification of dioxin-responsive elements dramatically increases CALUX bioassay sensitivity and responsiveness.Toxicol Sci. 2011 Oct;123(2):511-22. doi: 10.1093/toxsci/kfr189. Epub 2011 Jul 20. Toxicol Sci. 2011. PMID: 21775728 Free PMC article.
References
-
- Safe SH. Polychlorinated biphenyls (PCBs): Environmental impact, biochemical and toxic responses, and implications for risk assessment. Crit. Rev. Toxicol. 1994;24:87–149. - PubMed
-
- Birnbaum LS. TEFs: A practical approach to a real world problem. Hum. Ecol. Risk Assess. 1999;5:13–24.
-
- Goldstein JA, Safe S. Mechanism of action and structure–activity relationships for chlorinated dibenzo-p-dioxins and related compounds. In: Jenson KA, editor. Halogenated Biphenyls, Terphenyls, Napthalenes, Dibenzofurans, and Related Products. New York: Elsevier Science Publishers; 1989. pp. 239–293.
-
- Safe S. Polychlorinated biphenyls (PCBs), dibenzo-p-dioxins (PCDDs), dibenzofurans (PCDFs), and related compounds: Environmental and mechanistic considerations which support the development of toxic equivalency factors (TEFs) Crit. Rev. Toxicol. 1990;21:51–88. - PubMed
-
- McConnell EE, Moore JA, Haseman JK, Harris MW. The comparative toxicity of chlorinated dibenzo-p-dioxins in mice and guinea pigs. Toxicol. Appl. Pharmacol. 1978;44:335–356. - PubMed
Publication types
MeSH terms
Substances
Grants and funding
LinkOut - more resources
Full Text Sources
Other Literature Sources
Miscellaneous
