

An analysis of expression patterns of genes encoding proteins with catalytic activities
- PMID: 17626619
- PMCID: PMC1976134
- DOI: 10.1186/1471-2164-8-232
An analysis of expression patterns of genes encoding proteins with catalytic activities
Abstract
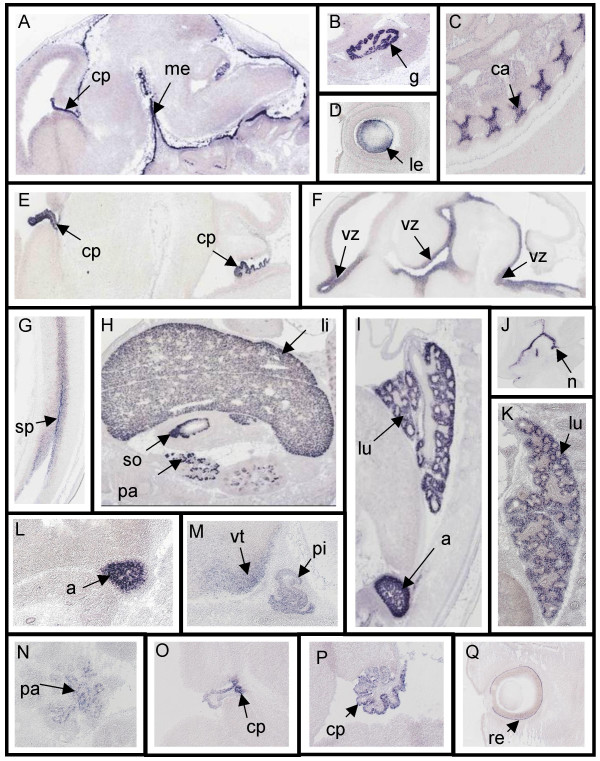
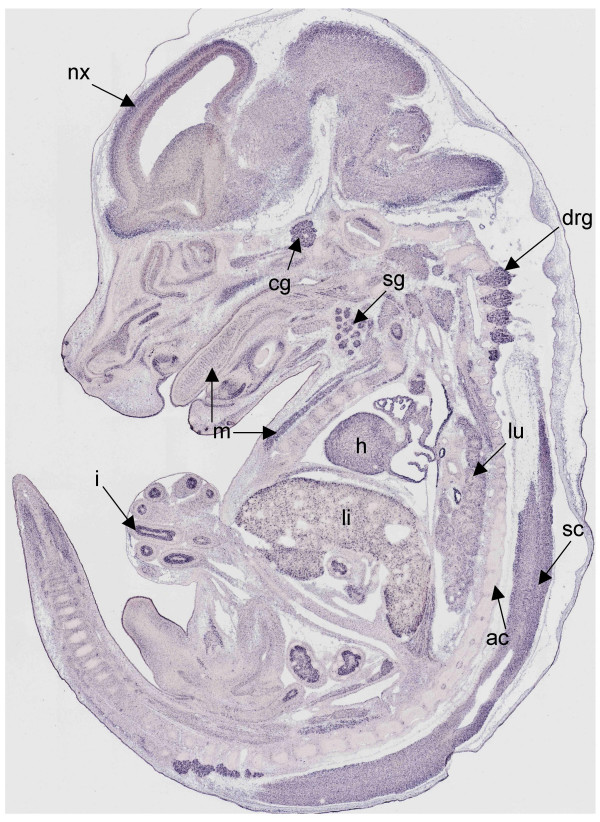
Background: In situ hybridization (ISH) is a powerful method for visualizing gene expression patterns at the organismal level with cellular resolution. When automated, it is capable of determining the expression of a large number of genes.
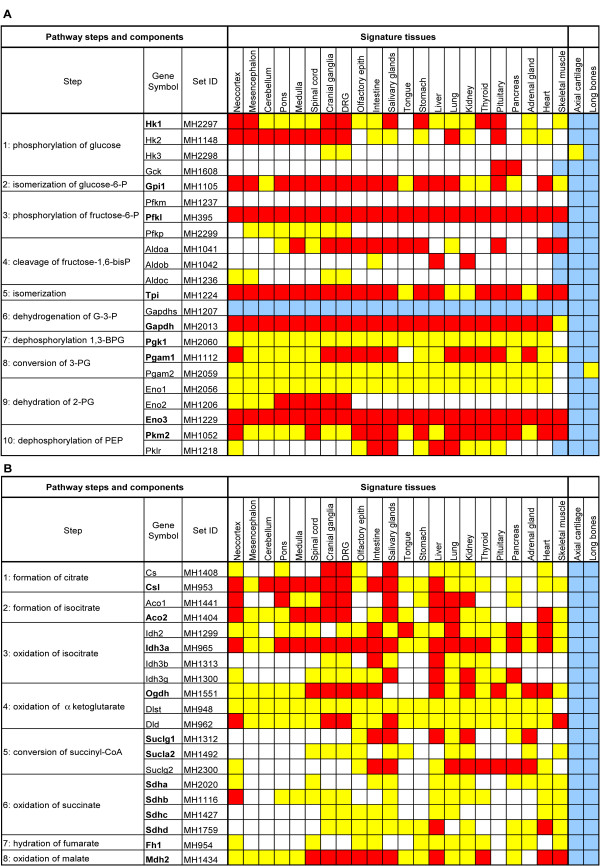
Results: The expression patterns of 662 genes that encode enzymes were determined by ISH in the mid-gestation mouse embryo, a stage that models the complexity of the adult organism. Forty-five percent of transcripts encoding metabolic enzymes (n = 297) showed a regional expression pattern. A similar percentage was found for the 190 kinases that were also analyzed. Many mRNAs encoding glycolytic and TCA cycle enzymes exhibited a characteristic expression pattern. The annotated expression patterns were deposited on the Genepaint database and are retrievable by user-defined queries including gene name and sites of expression.
Conclusion: The 662 expression patterns discussed here comprised gene products with activities associated with catalysis. Preliminary analysis of these data revealed that a significant number of genes encoding housekeeping functions such as biosynthesis and catabolism were expressed regionally, so they could be used as tissue-specific gene markers. We found no difference in tissue specificity between mRNAs encoding housekeeping functions and those encoding components of signal transduction pathways, as exemplified by the kinases.
Figures
References
-
- Lein ES, Hawrylycz MJ, Ao N, Ayres M, Bensinger A, Bernard A, Boe AF, Boguski MS, Brockway KS, Byrnes EJ, Chen L, Chen L, Chen TM, Chin MC, Chong J, Crook BE, Czaplinska A, Dang CN, Datta S, Dee NR, Desaki AL, Desta T, Diep E, Dolbeare TA, Donelan MJ, Dong HW, Dougherty JG, Duncan BJ, Ebbert AJ, Eichele G, Estin LK, Faber C, Facer BA, Fields R, Fischer SR, Fliss TP, Frensley C, Gates SN, Glattfelder KJ, Halverson KR, Hart MR, Hohmann JG, Howell MP, Jeung DP, Johnson RA, Karr PT, Kawal R, Kidney JM, Knapik RH, Kuan CL, Lake JH, Laramee AR, Larsen KD, Lau C, Lemon TA, Liang AJ, Liu Y, Luong LT, Michaels J, Morgan JJ, Morgan RJ, Mortrud MT, Mosqueda NF, Ng LL, Ng R, Orta GJ, Overly CC, Pak TH, Parry SE, Pathak SD, Pearson OC, Puchalski RB, Riley ZL, Rockett HR, Rowland SA, Royall JJ, Ruiz MJ, Sarno NR, Schaffnit K, Shapovalova NV, Sivisay T, Slaughterbeck CR, Smith SC, Smith KA, Smith BI, Sodt AJ, Stewart NN, Stumpf KR, Sunkin SM, Sutram M, Tam A, Teemer CD, Thaller C, Thompson CL, Varnam LR, Visel A, Whitlock RM, Wohnoutka PE, Wolkey CK, Wong VY, Wood M, Yaylaoglu MB, Young RC, Youngstrom BL, Yuan XF, Zhang B, Zwingman TA, Jones AR. Genome-wide atlas of gene expression in the adult mouse brain. Nature. 2007;445:168–176. doi: 10.1038/nature05453. - DOI - PubMed
-
- Visel A, Thaller C, Eichele G. GenePaint.org: an atlas of gene expression patterns in the mouse embryo. Nucleic Acids Res. 2004;32:D552–6. doi: 10.1093/nar/gkh029. - DOI - PMC - PubMed
Publication types
MeSH terms
Substances
LinkOut - more resources
Full Text Sources
Molecular Biology Databases
