

Patterns of population differentiation of candidate genes for cardiovascular disease
- PMID: 17626638
- PMCID: PMC1937006
- DOI: 10.1186/1471-2156-8-48
Patterns of population differentiation of candidate genes for cardiovascular disease
Abstract
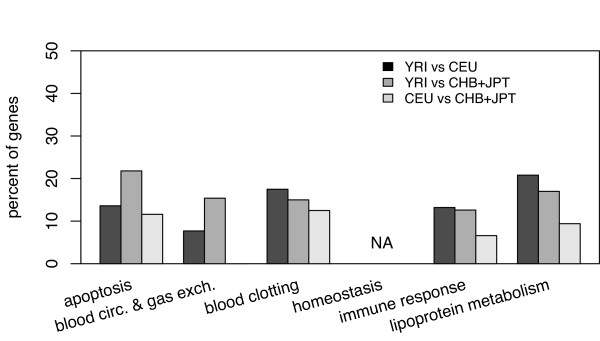
Background: The basis for ethnic differences in cardiovascular disease (CVD) susceptibility is not fully understood. We investigated patterns of population differentiation (FST) of a set of genes in etiologic pathways of CVD among 3 ethnic groups: Yoruba in Nigeria (YRI), Utah residents with European ancestry (CEU), and Han Chinese (CHB) + Japanese (JPT). We identified 37 pathways implicated in CVD based on the PANTHER classification and 416 genes in these pathways were further studied; these genes belonged to 6 biological processes (apoptosis, blood circulation and gas exchange, blood clotting, homeostasis, immune response, and lipoprotein metabolism). Genotype data were obtained from the HapMap database.
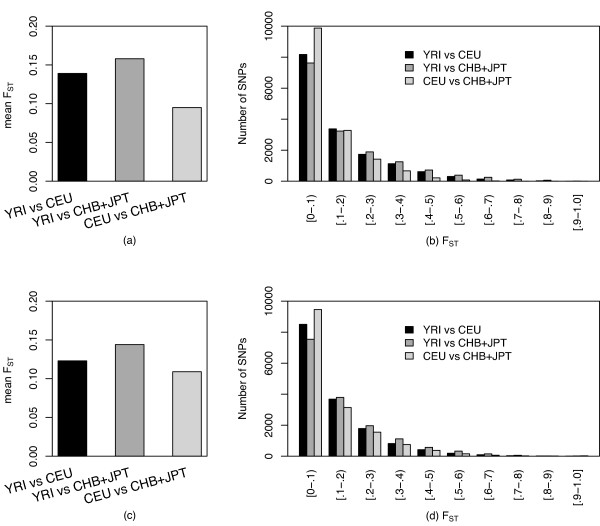
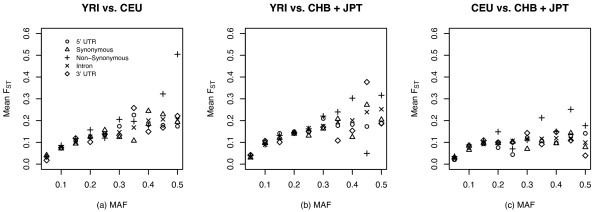
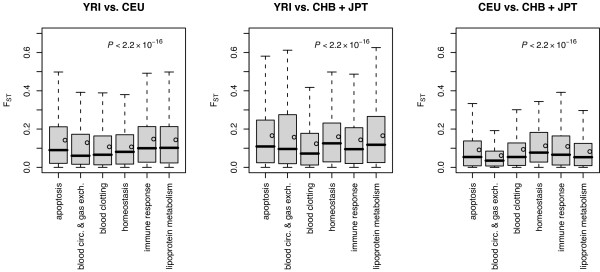
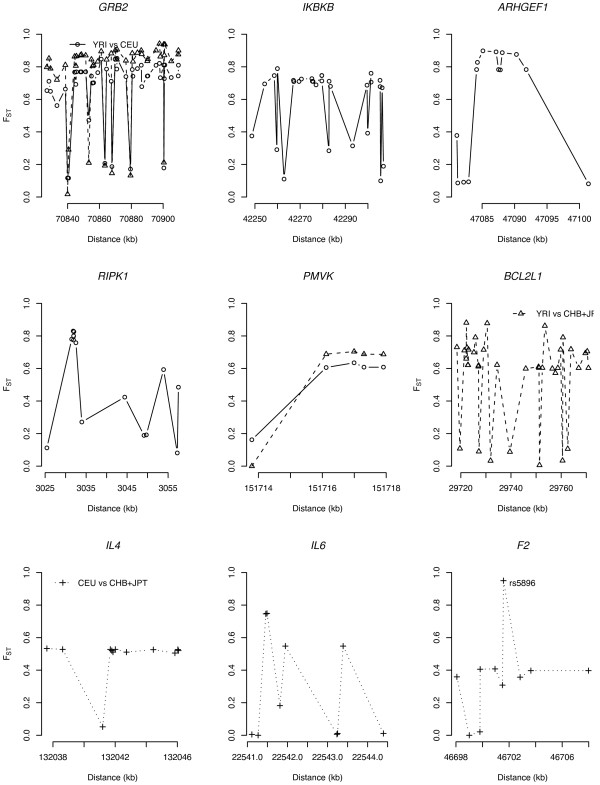
Results: We calculated FST for 15,559 common SNPs (minor allele frequency > or = 0.10 in at least one population) in genes that co-segregated among the populations, as well as an average-weighted FST for each gene. SNPs were classified as putatively functional (non-synonymous and untranslated regions) or non-functional (intronic and synonymous sites). Mean FST values for common putatively functional variants were significantly higher than FST values for nonfunctional variants. A significant variation in FST was also seen based on biological processes; the processes of 'apoptosis' and 'lipoprotein metabolism' showed an excess of genes with high FST. Thus, putative functional SNPs in genes in etiologic pathways for CVD show greater population differentiation than non-functional SNPs and a significant variance of FST values was noted among pairwise population comparisons for different biological processes.
Conclusion: These results suggest a possible basis for varying susceptibility to CVD among ethnic groups.
Figures
Similar articles
-
Comparison of Genetic Variants in Cancer-Related Genes between Chinese Hui and Han Populations.PLoS One. 2015 Dec 18;10(12):e0145170. doi: 10.1371/journal.pone.0145170. eCollection 2015. PLoS One. 2015. PMID: 26683024 Free PMC article.
-
[A cross-racial analysis on the susceptible gene polymorphisms of salt-sensitive hypertension].Zhonghua Xin Xue Guan Bing Za Zhi. 2010 Oct;38(10):943-8. Zhonghua Xin Xue Guan Bing Za Zhi. 2010. PMID: 21176642 Chinese.
-
Distribution patterns of variability for 18 immune system genes in Amerindians--relationship with history and epidemiology.Tissue Antigens. 2013 Sep;82(3):177-85. doi: 10.1111/tan.12183. Tissue Antigens. 2013. PMID: 24032724
-
Ethnic variability in the allelic distribution of pharmacogenes between Korean and other populations.Pharmacogenet Genomics. 2012 Dec;22(12):829-36. doi: 10.1097/FPC.0b013e328358dd70. Pharmacogenet Genomics. 2012. PMID: 22955668
-
[Analysis of the HapMap data on SNPs in SUMO1 and association study of rs7599810 in trios with non-syndromic cleft lip with or without cleft palate].Beijing Da Xue Xue Bao Yi Xue Ban. 2014 Apr 18;46(2):258-63. Beijing Da Xue Xue Bao Yi Xue Ban. 2014. PMID: 24743817 Chinese.
Cited by
-
Molecular population genetics of PCSK9: a signature of recent positive selection.Pharmacogenet Genomics. 2008 Mar;18(3):169-79. doi: 10.1097/FPC.0b013e3282f44d99. Pharmacogenet Genomics. 2008. PMID: 18300938 Free PMC article.
-
Deciphering climate resilience in Indian cattle breeds by selection signature analyses.Trop Anim Health Prod. 2024 Jan 17;56(2):46. doi: 10.1007/s11250-023-03879-8. Trop Anim Health Prod. 2024. PMID: 38233536
-
Evidence for positive selection in the C-terminal domain of the cholesterol metabolism gene PCSK9 based on phylogenetic analysis in 14 primate species.PLoS One. 2007 Oct 31;2(10):e1098. doi: 10.1371/journal.pone.0001098. PLoS One. 2007. PMID: 17971861 Free PMC article.
-
Geographic differences in allele frequencies of susceptibility SNPs for cardiovascular disease.BMC Med Genet. 2011 Apr 20;12:55. doi: 10.1186/1471-2350-12-55. BMC Med Genet. 2011. PMID: 21507254 Free PMC article.
-
Detection of selection signatures in dairy and beef cattle using high-density genomic information.Genet Sel Evol. 2015 Jun 19;47(1):49. doi: 10.1186/s12711-015-0127-3. Genet Sel Evol. 2015. PMID: 26089079 Free PMC article.
References
-
- Keys A. Coronary heart disease in seven countries. Circulation. 1970;41:1–211. - PubMed
-
- Davey Smith G, Neaton JD, Wentworth D, Stamler R, Stamler J. Mortality differences between black and white men in the USA: contribution of income and other risk factors among men screened for the MRFIT. MRFIT Research Group. Multiple Risk Factor Intervention Trial. Lancet. 1998;351:934–939. - PubMed
MeSH terms
Substances
LinkOut - more resources
Full Text Sources
Research Materials
Miscellaneous
