. 2007 Jul 13:8:251.
doi: 10.1186/1471-2105-8-251.

Bayesian Orthogonal Least Squares (BOLS) algorithm for reverse engineering of gene regulatory networks

Affiliations

Bayesian Orthogonal Least Squares (BOLS) algorithm for reverse engineering of gene regulatory networks

Chang Sik Kim. BMC Bioinformatics. .

Abstract

Background: A reverse engineering of gene regulatory network with large number of genes and limited number of experimental data points is a computationally challenging task. In particular, reverse engineering using linear systems is an under-determined and ill conditioned problem, i.e. the amount of microarray data is limited and the solution is very sensitive to noise in the data. Therefore, the reverse engineering of gene regulatory networks with large number of genes and limited number of data points requires rigorous optimization algorithm.

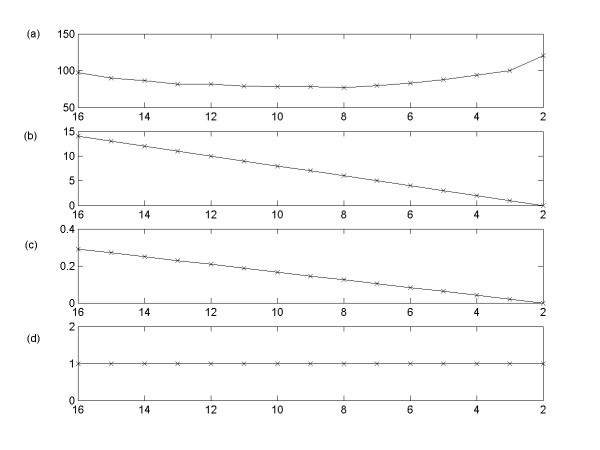
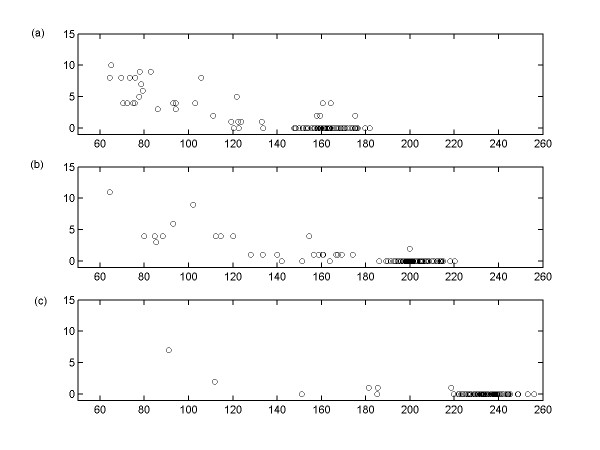
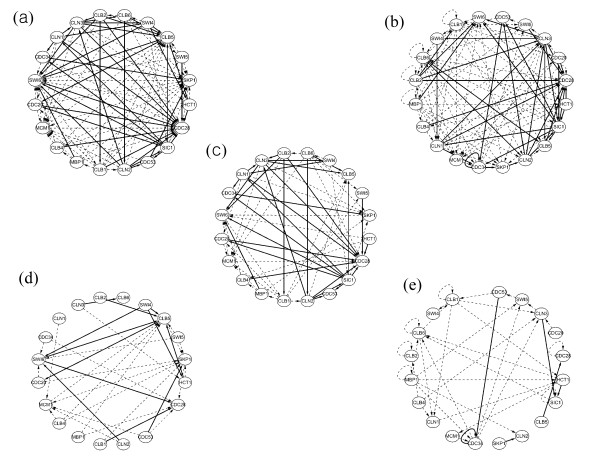
Results: This study presents a novel algorithm for reverse engineering with linear systems. The proposed algorithm is a combination of the orthogonal least squares, second order derivative for network pruning, and Bayesian model comparison. In this study, the entire network is decomposed into a set of small networks that are defined as unit networks. The algorithm provides each unit network with P(D|Hi), which is used as confidence level. The unit network with higher P(D|Hi) has a higher confidence such that the unit network is correctly elucidated. Thus, the proposed algorithm is able to locate true positive interactions using P(D|Hi), which is a unique property of the proposed algorithm. The algorithm is evaluated with synthetic and Saccharomyces cerevisiae expression data using the dynamic Bayesian network. With synthetic data, it is shown that the performance of the algorithm depends on the number of genes, noise level, and the number of data points. With Yeast expression data, it is shown that there is remarkable number of known physical or genetic events among all interactions elucidated by the proposed algorithm. The performance of the algorithm is compared with Sparse Bayesian Learning algorithm using both synthetic and Saccharomyces cerevisiae expression data sets. The comparison experiments show that the algorithm produces sparser solutions with less false positives than Sparse Bayesian Learning algorithm.

Conclusion: From our evaluation experiments, we draw the conclusion as follows: 1) Simulation results show that the algorithm can be used to elucidate gene regulatory networks using limited number of experimental data points. 2) Simulation results also show that the algorithm is able to handle the problem with noisy data. 3) The experiment with Yeast expression data shows that the proposed algorithm reliably elucidates known physical or genetic events. 4) The comparison experiments show that the algorithm more efficiently performs than Sparse Bayesian Learning algorithm with noisy and limited number of data.


Figures

Figure 1
Figure 1
The Bayesian Orthogonal Least Squares algorithm could be used as a framework for gene regulatory study including the collecting and modeling of data.
Figure 2
Figure 2
The schematic of unit network. (a) Input unit network consisting of target gene Yi and all other genes as regulator candidates. (b) Output unit network consisting of target gene Yi and its most probable regulators.
Figure 3
Figure 3
ROC analysis of BOLS output with K = 100. (a) N = 5 and ε = 0.01, (b) N = 5 and ε = 0.05, (c) N = 5 and ε = 0.1, (d) N = 10 and ε = 0.01, (e) N = 10 and ε = 0.05, (f) N = 10 and ε = 0.1, (g) N = 15 and ε = 0.01, (h) N = 15 and ε = 0.05, (i) N = 15 and ε = 0.1. For all Figures, the x-axis corresponds to the complementary specificity, the y-axis sensitivity.
Figure 4
Figure 4
ROC analysis of BOLS output with N = 10. (a) K = 100 and ε = 0.01, (b) K = 100 and ε = 0.05, (c) K = 100 and ε = 0.1, (d) K = 200 and ε = 0.01, (e) K = 200 and ε = 0.05, (f) K = 200 and ε = 0.1, (g) K = 300 and ε = 0.01, (h) K = 300 and ε = 0.05, (i) K = 300 and ε = 0.1. For all Figures, the x-axis corresponds to the complementary specificity, the y-axis sensitivity.
Figure 5
Figure 5
The changes of performance of BOLS as the network pruning step proceeds. The simulation experiment is done with N = 50, K = 20, and ε = 0.1. In these Figures, we concentrate on an output unit-network that has the highest logP(D|Hi) among all output unit networks. For all Figures, the x-axis corresponds to the number of inferred interactions: as the network pruning proceeds, the number of inferred interactions in unit network decreases. Each y-axis corresponds to (a) logP(D|Hi), (b) the number of errors (FP+FN), (c) the complementary specificity, (d) the sensitivity.
Figure 6
Figure 6
The relationship between the evidence value P(D|Hi) and the number of errors for unit networks, where K = 100, ε = 1.0e-2, and mmax = 4. (a) N = 10, (b) N = 15, (c) N = 20. For all Figures, the x-axis corresponds to log(P(D|Hi)), the y-axis the number of errors
Figure 7
Figure 7
The inferred GRN by both BOLS and SBL are compared with the same expression data used in Table 2. (a) A GRN by BOLS, (b) A GRN by SBL, (c) The inferred interactions both by BOLS and SBL, (d) The inferred interactions only by BOLS, (e) The inferred interactions only by SBL. For all figures, the solid line correspond the inferred interactions which are identified as known physical or genetic interactions from the BioGRID database, and the dashed line the unknown interactions.

Similar articles

Cited by

References

    1. Altman RB, Raychaudhuri S. Whole genome expression analysis: challenges beyond clustering. Curr Opin Struct Biol. 2001;11:340–347. doi: 10.1016/S0959-440X(00)00212-8. - DOI - PubMed
    1. Brown MP, Grundy WN, Lin D, Cristianini N, Sugnet CW, Furey TS, Ares M, Haussler D. Knowledge-based analysis of microarray gene expression data by using support vector machines. Proc Natl Acad Sci USA. 2000;97:262–267. doi: 10.1073/pnas.97.1.262. - DOI - PMC - PubMed
    1. Huges JD, Estep PW, Tavazoi S, Church GM. Computational identification of cis-regulatory elements associated with groups of functionally related genes in Sacchaaromyces cerevisiae. J Mol Biol. 2000;296:1205–1214. doi: 10.1006/jmbi.2000.3519. - DOI - PubMed
    1. Jansen R, Greenbaum D, Gerstein M. Relating whole-genome expression data with protein-protein interactions. Genome Res. 2000;12:37–46. doi: 10.1101/gr.205602. - DOI - PMC - PubMed
    1. Niehrs C, Pollet N. Synexpression groups in eukaryotes. Nature. 1999;402:483–487. doi: 10.1038/990025. - DOI - PubMed

Publication types

MeSH terms

Substances

LinkOut - more resources