. 2007 Jul 17;104(29):12057-62.
doi: 10.1073/pnas.0705323104. Epub 2007 Jul 12.

Genome-wide patterns of single-feature polymorphism in Arabidopsis thaliana

Affiliations

Genome-wide patterns of single-feature polymorphism in Arabidopsis thaliana

Justin O Borevitz et al. Proc Natl Acad Sci U S A. .

Abstract

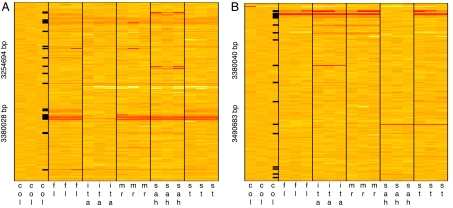
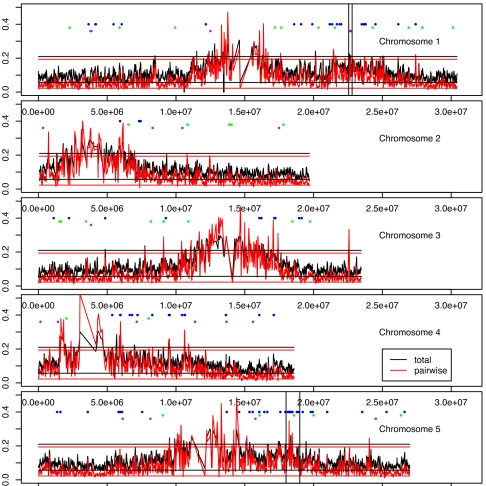
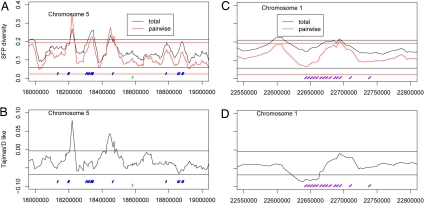
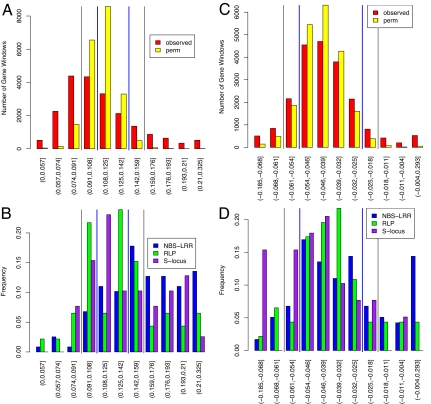
We used hybridization to the ATH1 gene expression array to interrogate genomic DNA diversity in 23 wild strains (accessions) of Arabidopsis thaliana (arabidopsis), in comparison with the reference strain Columbia (Col). At <1% false discovery rate, we detected 77,420 single-feature polymorphisms (SFPs) with distinct patterns of variation across the genome. Total and pair-wise diversity was higher near the centromeres and the heterochromatic knob region, but overall diversity was positively correlated with recombination rate (R(2) = 3.1%). The difference between total and pair-wise SFP diversity is a relative measure contrasting diversifying or frequency-dependent selection, similar to Tajima's D, and can be calibrated by the empirical genome-wide distribution. Each unique locus, centered on a gene, has a diversity and selection score that suggest a relative role in past evolutionary processes. Homologs of disease resistance (R) genes include members with especially high levels of diversity often showing frequency-dependent selection and occasionally evidence of a past selective sweep. Receptor-like and S-locus proteins also contained members with elevated levels of diversity and signatures of selection, whereas other gene families, bHLH, F-box, and RING finger proteins, showed more typical levels of diversity. SFPs identified with the gene expression array also provide an empirical hybridization polymorphism background for studies of gene expression polymorphism and are available through the genome browser http://signal.salk.edu/cgi-bin/AtSFP.


Conflict of interest statement

The authors declare no conflict of interest.

Figures

Fig. 1.
Fig. 1.
SFP haplotype structure across Arabidopsis accessions. Feature intensities are shown as a heat map across three replicate columns of six accessions from experiment 3. Lower and higher relative SFP hybridization intensities are in red and white, respectively, as compared with the reference Col. Those in orange do not show significant variation but are included to show genotyping density. Rows correspond to 250 consecutive 25-mer features across adjacent genes and thus are not equally spaced. Black tick marks in Col show significant SFPs from the D stat threshold. (A) The haplotype patterns are clearly seen where Ita is similar to Col, whereas Fl, Mr, and St are quite similar to each other, and Sah has a third pattern. (B) The patterns change along the chromosome due to ancestral recombination events moving a Col haplotype onto Sah and a new haplotype onto Ita. Heat maps of the entire genome are available for each of five experiments (http://naturalvariation.org/accessionSFP/supplement/HapMapImages).
Fig. 2.
Fig. 2.
Diversity along the five Arabidopsis chromosomes. The y axis shows SFP diversity at each 50-kb interval centered on a gene. The centromeres on all chromosomes, as well as the heterochromatic knob near the top of chromosome 4, are highly elevated compared with the rest of the genome, although estimates are less dense there as well. Variation spikes are also rampant. The blue dashes represent R genes, the green dashes represent RLPs, and the purple dashes represent S-locus proteins. Both total diversity (black) and pairwise diversity (red) reveal unusually high or low levels of variation exceeding the 2.5% genome-wide thresholds (horizontal black line, θ; red line, π). Vertical lines demark regions shown in detail in Fig. 3.
Fig. 3.
Fig. 3.
SFPs reveal local regions of diversity and patterns of selection in the R and S-locus like genes. (A) A closer look at 18–19 Mb on chromosome 5 reveals interesting patterns of variation. (B) Contrasting the different measures of diversity allows one to infer the type of selective forces acting at different adjacent loci. For the gene clusters at 18.2 and 18.44 Mb, pairwise diversity is higher than total diversity, suggesting a pattern of frequency-dependent selection rare in the genome. This pattern is observed only at some of the R genes (blue bars) in the cluster. The pattern of variation at the central locus, 18.33 RPS4, however, is common in the genome. (C) Another region with high diversity spans a cluster of S-locus proteins, the gene family involved in self incompatibility. (D) Regions spanning this cluster show both rare negative and positive Tajima's D scores, suggesting a selective sweep near 22.65 Mb and frequency-dependent selection near 22.7 Mb. Plots of the entire genome are shown in SI Fig. 6. Colors and thresholds are as in Fig. 2.
Fig. 4.
Fig. 4.
Distribution of diversity and selection statistics at the genome and gene family level. The vertical black lines delimit 95% of the gene position-shuffled null distribution (P < 0.05 outside). The vertical blue lines represent a <2% FDR under the same null distribution. (A) Empirical distribution of diversity in 50-kb windows in red is shown relative to the gene position shuffled null distribution in yellow. (B) In comparison to the genome-wide distribution directly above (red), the diversity seen in select gene families is elevated or shifted to the right. (C) The empirical (red) and null (yellow) Tajima's D distribution is shown. (D) Tajima's D distribution in select gene families is enriched in both the lower and upper tail, suggesting that selection has acted on regions where these genes reside. SI Fig. 8 shows that the distribution across control gene families is similar to the genome-wide distribution.

Comment in

Similar articles

Cited by

References

    1. Toomajian C, Hu TT, Aranzana MJ, Lister C, Tang C, Zheng H, Zhao K, Calabrese P, Dean C, Nordborg M. PLoS Biol. 2006;4:e137. - PMC - PubMed
    1. Yoshida K, Kamiya T, Kawabe A, Miyashita NT. Genes Genet Syst. 2003;78:11–21. - PubMed
    1. Miyashita NT, Kawabe A, Innan H. Genetics. 1999;152:1723–1731. - PMC - PubMed
    1. Sharbel TF, Haubold B, Mitchell-Olds T. Mol Ecol. 2000;9:2109–2118. - PubMed
    1. Nordborg M, Borevitz JO, Bergelson J, Berry CC, Chory J, Hagenblad J, Kreitman M, Maloof JN, Noyes T, Oefner PJ, et al. Nat Genet. 2002;30:190–193. - PubMed

Publication types

LinkOut - more resources