. 2007 Aug 15;21(16):1999-2004.
doi: 10.1101/gad.1565607. Epub 2007 Jul 12.

A Slicer-independent role for Argonaute 2 in hematopoiesis and the microRNA pathway

Affiliations

A Slicer-independent role for Argonaute 2 in hematopoiesis and the microRNA pathway

Dónal O'Carroll et al. Genes Dev. .

Abstract

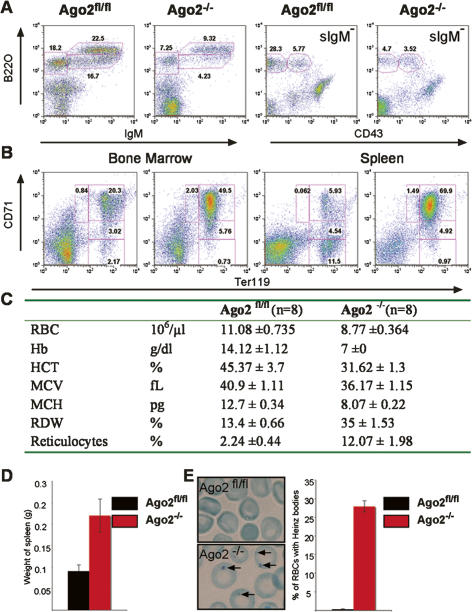
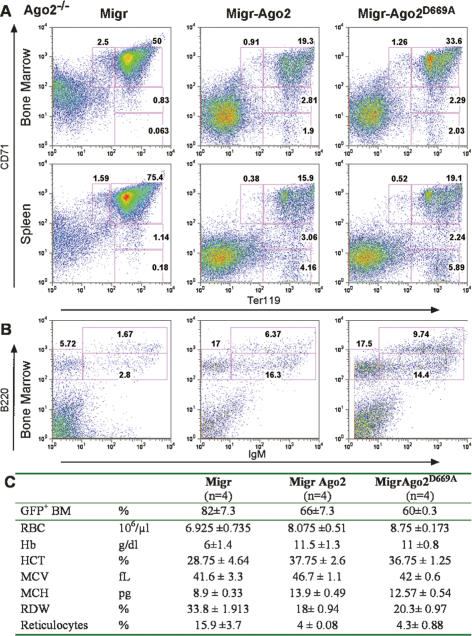
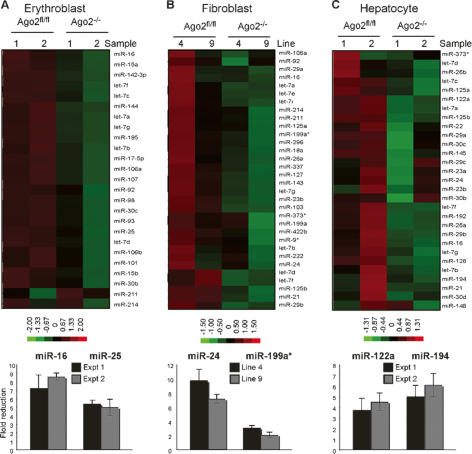
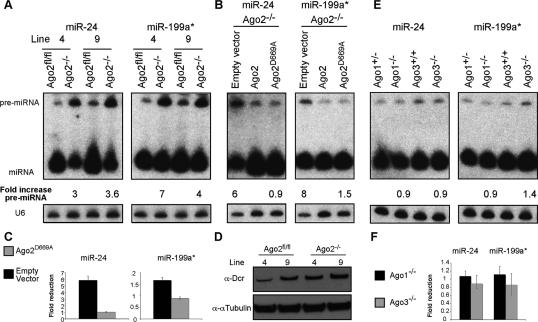
Binding of microRNA (miRNA) to mRNA within the RNA-induced silencing complex (RISC) leads to either translational inhibition or to destruction of the target mRNA. Both of these functions are executed by Argonaute 2 (Ago2). Using hematopoiesis in mice as a model system to study the physiological function of Ago2 in vivo, we found that Ago2 controls early development of lymphoid and erythroid cells. We show that the unique and defining feature of Ago2, the Slicer endonuclease activity, is dispensable for hematopoiesis. Instead, we identified Ago2 as a key regulator of miRNA homeostasis. Deficiency in Ago2 impairs miRNA biogenesis from precursor-miRNAs followed by a reduction in miRNA expression levels. Collectively, our data identify Ago2 as a highly specialized member of the Argonaute family with an essential nonredundant Slicer-independent function within the mammalian miRNA pathway.


Figures

Figure 1.
Figure 1.
Ago2 is required for normal hematopoiesis. Representative FACS analysis are shown of B lymphoid in the bone marrow (A) and erythroid cell populations in the bone marrow and spleen (B) of Ago2fl/fl and Ago2−/− mice. Numbers indicate the percentages of cells of the developmentally defined subpopulations. (C) Ago2 deficiency alters erythrocyte parameters in the peripheral blood. (RBC) Red blood cell; (Hb) hemoglobin; (HCT) hematocrit; (MCV) mean cell volume; (MCH) mean corpuscular hemoglobin; (RDW) red cell distribution width. (D) Splenomegaly in Ago2−/− mice. Splenomegaly was determined by the weight of spleens. Bars represent mean values (n = 8), and error bars indicate standard deviation. (E) Heinz bodies (indicated by arrows) identified by staining of blood smears (images) with methylene blue and counted by light microscopy. Bars represent mean percentages of Hz bodies in the respective genotypes (n = 4), and error bars indicate standard deviation.
Figure 2.
Figure 2.
Ago2 control of hematopoiesis is Slicer independent. (A,B) Slicer-inactive Ago2 supports wild-type B-cell development and erythropoiesis. Representative FACS profiles of erythroid (A) and B-lymphoid (B) populations derived from bone marrow chimeras generated with Ago2−/− cells transduced with control vector (Migr), exogenous Ago2 (Migr-Ago2), or slicer-inactive Ago2 (Migr-Ago2D669A). Transduced cells identified by the expression of GFP are shown. Numbers indicate the percentages of gated cells. (C) Slicer-inactive Ago2 normalizes erythrocyte parameters in the peripheral blood. The table displays hematological parameters of the bone marrow-derived blood cells. The frequencies (percentage of live cells) of bone marrow GFP+ cells in bone marrow chimeras used for the analysis are shown. (RBC) Red blood cell; (Hb) hemoglobin; (HCT) hematocrit; (MCV) mean cell volume; (MCH) mean corpuscular hemoglobin; (RDW) red cell distribution width.
Figure 3.
Figure 3.
Ago2 controls miRNA expression levels. Reduced miRNA expression levels in the absence of Ago2. The levels of miRNA expression in Ago2fl/fl and Ago2−/− erythroblasts (A), fibroblasts (B), or hepatocytes (C) were measured by miRNA array profiling (top) and qRT–PCR (bottom). (Top panels) Heat maps of miRNA expression from the Ago2fl/fl and Ago2−/− cells are shown. Two independent preparations (Sample 1 and 2) or, in the case of fibroblasts, cell lines 4 and 9, are shown. Increased or decreased amount of miRNA relative to the median are indicated in red and green, respectively; normalized fold changes are indicated in the color bar. Ranges in the color bar refer to gene standard deviations. (Bottom panels) Expression levels of two representative miRNAs were quantified by qRT–PCR. The U6 normalized expression of miRNAs in mutant cells is plotted as fold reduction over the level of miRNA expression in Ago2fl/fl cells. The mean and standard deviation of three independent measurements, each made in duplicate, are shown.
Figure 4.
Figure 4.
Ago2 deficiency selectively impairs miRNA biogenesis. (A) Pre-miRNA accumulation in Ago2−/− fibroblast cell lines. The expression levels of pre-miRNA and miRNA were measured by Northern blotting using probes specific for miR-24 and miR-199a*. U6 snRNA was used as a loading control. The positions of pre-miRNA and miRNA are indicated. The U6 normalized fold increase in the pre-miRNA in Ago2−/− cells is shown. (B,C) Ago2D669A restores pre-miRNA processing and miRNA expression levels in fibroblasts. (B) Pre-miR-24 and pre-miR-199a were measured and presented as in A. The U6 normalized fold increase in pre-miRNA expression levels in the indicated Ago2−/− reconstituted cell lines relative to Ago2−/− cells complemented with wild-type Ago2 are indicated. (C) Expression levels of two representative miRNAs were quantified by qRT–PCR. The U6 normalized expression of miRNAs in Ago2−/− cells complemented as indicated is plotted as fold reduction over the level of miRNA expression in Ago2−/− cells complemented with wild-type Ago2. The mean and standard deviation of three independent measurements, each made in duplicate, are shown. (D) Unaltered expression of Dicer in the absence of Ago2. The expression of Dicer in Ago2−/− fibroblasts was confirmed by immunoblotting with an α-Dcr antibody. Protein loading was controlled with α-αTubulin antiserum. (E,F) Normal expression of pre-miRNA and miRNA in Ago1- and Ago3-deficient fibroblast cell lines. (E) Total RNA was isolated from Ago1+/−, Ago1−/−, Ago3+/+, and Ago3−/− fibroblast cell lines. The expression levels of pre-miR-24 and pre-miR-199a were measured by Northern blotting and presented as above. (F) Expression levels of two representative miRNAs were quantified by qRT–PCR. The U6 normalized expression of miRNAs in the Ago1−/− and Ago3−/− cells is plotted as fold reduction over the level of miRNA expression in the respective control cell lines.

Comment in

Similar articles

Cited by

References

    1. Chen C.Z., Li L., Lodish H.F., Bartel D.P., Li L., Lodish H.F., Bartel D.P., Lodish H.F., Bartel D.P., Bartel D.P. MicroRNAs modulate hematopoietic lineage differentiation. Science. 2004;303:83–86. - PubMed
    1. Chendrimada T.P., Gregory R.I., Kumaraswamy E., Norman J., Cooch N., Nishikura K., Shiekhattar R., Gregory R.I., Kumaraswamy E., Norman J., Cooch N., Nishikura K., Shiekhattar R., Kumaraswamy E., Norman J., Cooch N., Nishikura K., Shiekhattar R., Norman J., Cooch N., Nishikura K., Shiekhattar R., Cooch N., Nishikura K., Shiekhattar R., Nishikura K., Shiekhattar R., Shiekhattar R. TRBP recruits the Dicer complex to Ago2 for microRNA processing and gene silencing. Nature. 2005;436:740–744. - PMC - PubMed
    1. Cobb B.S., Nesterova T.B., Thompson E., Hertweck A., O’Connor E., Godwin J., Wilson C.B., Brockdorff N., Fisher A.G., Smale S.T., Nesterova T.B., Thompson E., Hertweck A., O’Connor E., Godwin J., Wilson C.B., Brockdorff N., Fisher A.G., Smale S.T., Thompson E., Hertweck A., O’Connor E., Godwin J., Wilson C.B., Brockdorff N., Fisher A.G., Smale S.T., Hertweck A., O’Connor E., Godwin J., Wilson C.B., Brockdorff N., Fisher A.G., Smale S.T., O’Connor E., Godwin J., Wilson C.B., Brockdorff N., Fisher A.G., Smale S.T., Godwin J., Wilson C.B., Brockdorff N., Fisher A.G., Smale S.T., Wilson C.B., Brockdorff N., Fisher A.G., Smale S.T., Brockdorff N., Fisher A.G., Smale S.T., Fisher A.G., Smale S.T., Smale S.T., et al. T cell lineage choice and differentiation in the absence of the RNase III enzyme Dicer. J. Exp. Med. 2005;201:1367–1373. - PMC - PubMed
    1. Doench J.G., Petersen C.P., Sharp P.A., Petersen C.P., Sharp P.A., Sharp P.A. siRNAs can function as miRNAs. Genes & Dev. 2003;17:438–442. - PMC - PubMed
    1. Farley F.W., Soriano P., Steffen L.S., Dymecki S.M., Soriano P., Steffen L.S., Dymecki S.M., Steffen L.S., Dymecki S.M., Dymecki S.M. Widespread recombinase expression using FLPeR (flipper) mice. Genesis. 2000;28:106–110. - PubMed

Publication types

MeSH terms