. 2007 Jul 15;21(14):1803-16.
doi: 10.1101/gad.1544107. Epub 2007 Jul 12.

RGS10-null mutation impairs osteoclast differentiation resulting from the loss of [Ca2+]i oscillation regulation

Affiliations

RGS10-null mutation impairs osteoclast differentiation resulting from the loss of [Ca2+]i oscillation regulation

Shuying Yang et al. Genes Dev. .

Abstract

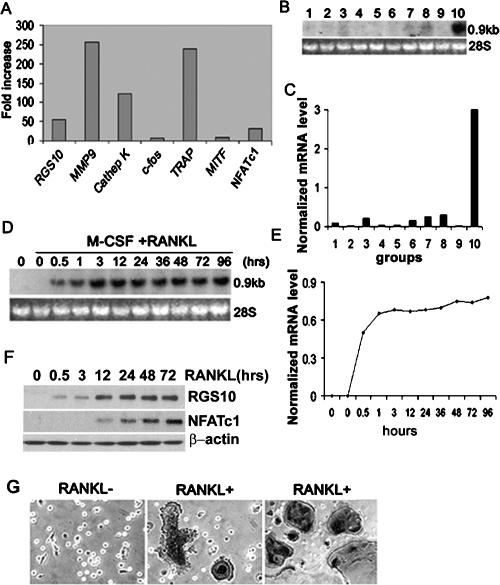
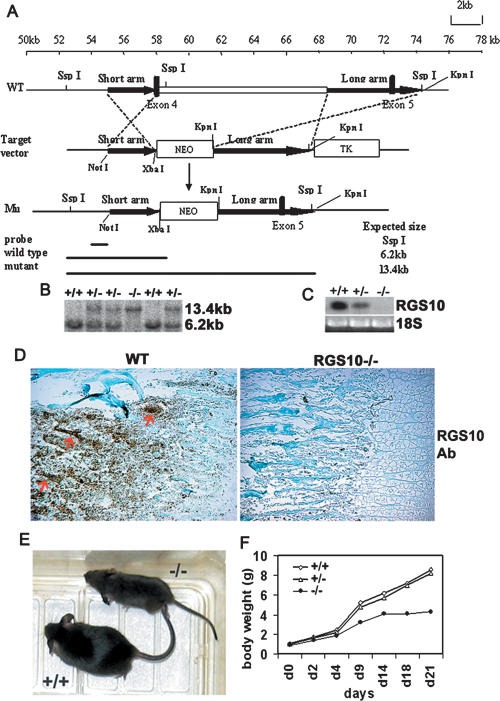
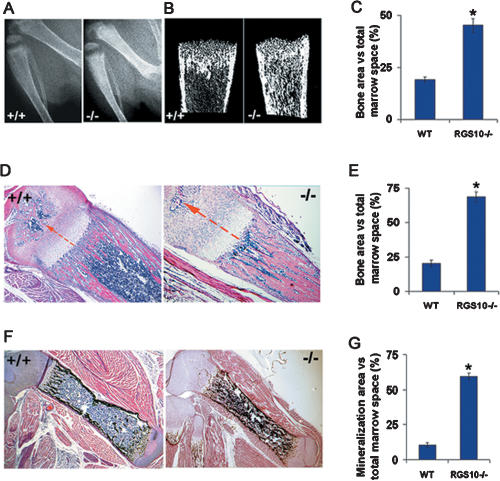
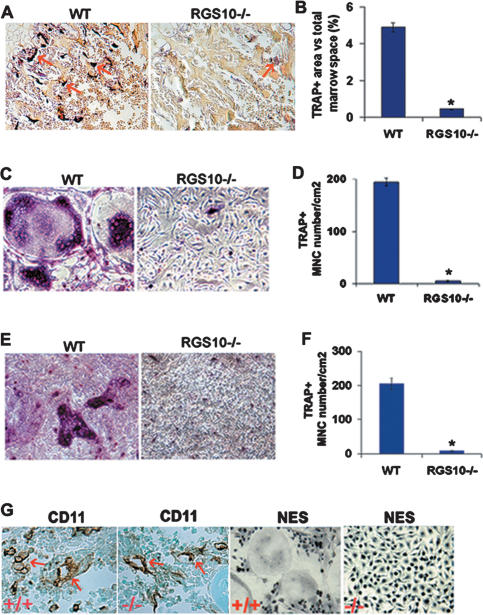
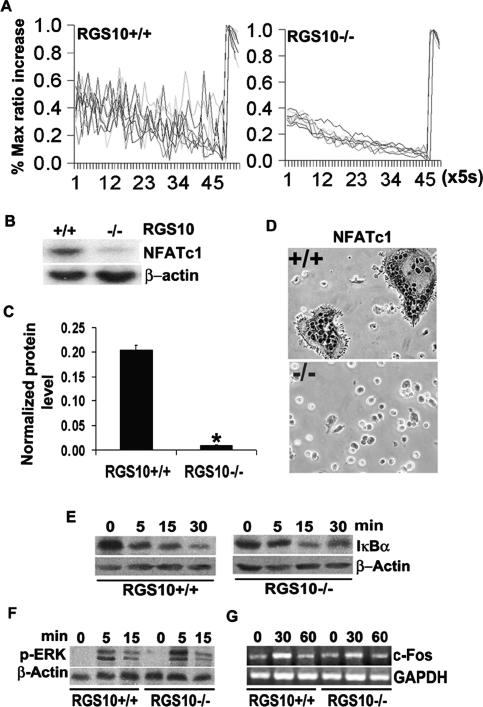
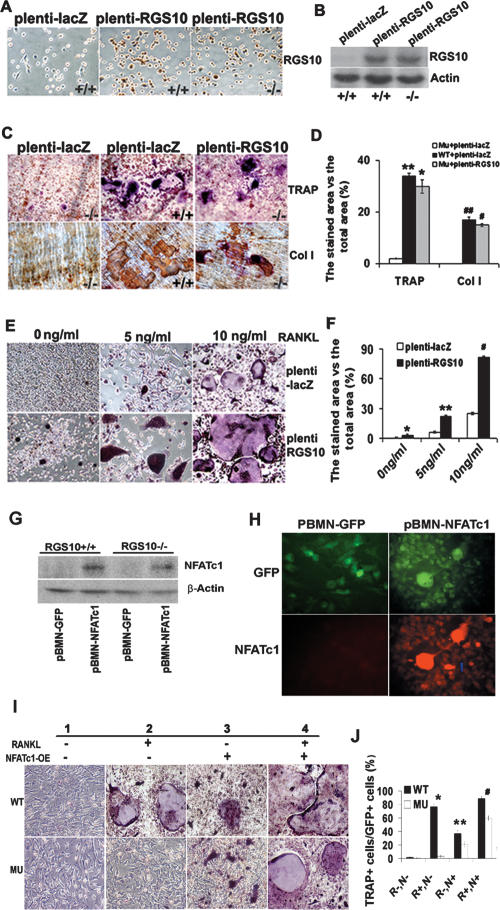
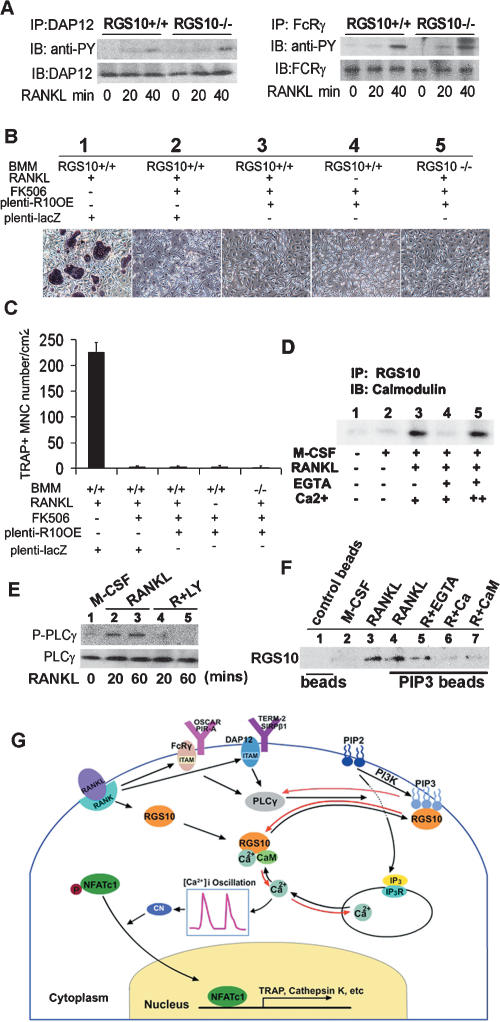
Increased osteoclastic resorption leads to many bone diseases, including osteoporosis and rheumatoid arthritis. While rapid progress has been made in characterizing osteoclast differentiation signaling pathways, how receptor activator of nuclear factor kappaB (NF-kappaB) ligand (RANKL) evokes essential [Ca2+]i oscillation signaling remains unknown. Here, we characterized RANKL-induced signaling proteins and found regulator of G-protein signaling 10 (RGS10) is predominantly expressed in osteoclasts. We generated RGS10-deficient (RGS10-/-) mice that exhibited severe osteopetrosis and impaired osteoclast differentiation. Our data demonstrated that ectopic expression of RGS10 dramatically increased the sensitivity of osteoclast differentiation to RANKL signaling; the deficiency of RGS10 resulted in the absence of [Ca2+]i oscillations and loss of NFATc1; ectopic NFATc1 expression rescues impaired osteoclast differentiation from deletion of RGS10; phosphatidylinositol 3,4,5-trisphosphate (PIP3) is essential to PLCgamma activation; and RGS10 competitively interacts with Ca2+/calmodulin and PIP3 in a [Ca2+]i-dependent manner to mediate PLCgamma activation and [Ca2+]i oscillations. Our results revealed a mechanism through which RGS10 specifically regulates the RANKL-evoked RGS10/calmodulin-[Ca2+]i oscillation-calcineurin-NFATc1 signaling pathway in osteoclast differentiation using an in vivo model. RGS10 provides a potential therapeutic target for the treatment of bone diseases.


Figures

Figure 1.
Figure 1.
RGS10 is prominently expressed in osteoclasts and osteoclast precursors induced by RANKL/M-CSF. (A) Genome-wide screening of osteoclast-specific genes by GeneChip. mRNAs of osteoclast marker genes matrix metalloprotease (MMP9), cathepsin K, TRAP, and NFATc1 were strongly expressed in osteoclasts, confirming the validity of our screening protocol. RGS10 was prominently expressed in human osteoclasts. (B) Northern blot analysis of RGS10 mRNA. Total RNA was extracted from human tissues and cell lines. (Lane 1) U-937. (Lane 2) HOS-TE85. (Lane 3) Hep-2. (Lane 4) HSB-2. (Lane 5) Skeletal muscle. (Lane 6) Liver. (Lane 7) Kidney. (Lane 8) Brain. (Lane 9) Human stromal cells. (Lane 10) Human osteoclastoma. (C) Normalized mRNA level of B. (D) Time-course Northern blot analysis of mouse RGS10 mRNA expression in preosteoclasts and osteoclasts derived from BMMs induced with RANKL/M-CSF at 0, 0.5, 1, 3, 12, 24, 36, 48, 72, and 96 h. RGS10 mRNA was undetectable in BMMs and BMMs treated with only M-CSF. After RANKL/M-CSF induction, the dominant expression of RGS10 starts at 0.5 h and continues to increase until 3 h, and then the expression of RGS10 remains at the same level. (E) Normalized mRNA level of D. (F) Time-course Western blot analysis of RGS10 expression in preosteoclasts and osteoclasts derived from BMMs induced with RANKL/M-CSF at 0, 0.5, 3, 12, 24, 48, and 72 h confirmed that expression of RGS10 starts at 0.5 h and remains level after 3 h. Expression of NFATc1 starts at 12 h. (G) RGS10 is strongly expressed in RANKL-induced MNCs detected by anti-RGS10 immunostaining (middle panel) as compared with BMMs without RANKL induction (left panel). (Right panel) These MNCs were confirmed to be TRAP+ osteoclasts by TRAP staining.
Figure 2.
Figure 2.
Generation of RGS10-null mice. (A) Targeting vector for RGS10 was constructed by inserting a 1.5-kb PCR fragment as the short arm and a 5-kb KpnI fragment as the long arm, which are flanked by the neomycin-resistance cassette. Targeted allele cells were produced by replacing 10 kb of RGS10 (including exon 4, which encodes amino acids 85–133, covering most of the RGS domain) with the PGK-neo cassette to delete the RGS10 domain for null mutation. (B) Genotype analysis of mice by Southern blot. The presence of a single 13.4-kb fragment indicates a homozygous RGS10−/− genotype. (C) Northern blot analysis of RNA isolated from long bone of 3-d-old wild-type and homozygous mutant littermates. The mRNA was detectable in long bone of wild-type and heterozygous mice, but undetectable in the homozygous mutant mice, using RGS10 cDNA as a probe. (D) Anti-RGS10 immunostaining of 10-d-old wild-type and RGS10−/− tibiae. RGS10 was expressed in wild-type osteoclasts (arrows), but not in RGS10−/− cells. (E) Appearance of RGS10−/− mice at day 20. (F) Growth curve of RGS10−/− mice compared with littermates.
Figure 3.
Figure 3.
Increased bone mass in RGS10−/− mice. (A) Radiographic analysis of 10-d-old RGS10+/+ and RGS10−/− mice. Tibiae from RGS10−/− mice show increased density of both cortical and trabecular bones. (B) Micro-CT images of tibiae from RGS10+/+ and RGS10−/− mice. Note that increased trabecular and cortical bone mass was observed. (C) Quantitative analysis of the ratio of bone area to total marrow space at different positions of tibiae isolated from wild-type and RGS10−/− mice. Increased cortical and trabecular bone mass was indicated. (*) P < 0.01, significant difference from wild type (student’s t-test). (D,F) Histomorphologic analysis of sections of tibiae from 10-d-old RGS10+/+ and RGS10−/− mice. Histologic sections of tibiae were stained with H&E (D) or Von Kossa staining (F) to visualize bone mass. The growth plates of RGS10−/− mice at 10 d had an extended zone of calcified cartilage compared with RGS10+/+ controls, and the zone of the hypertrophic chondrocytes was increased (arrows in D). (E,G) Quantitative analysis of bone of wild-type and RGS10−/− mice expressed as the percentage of bone area (E) or mineralization area (G) versus total marrow space. N = 3; (*) P < 0.01, significant difference from wild type (student’s t-test).
Figure 4.
Figure 4.
Defective osteoclastogenesis in RGS10−/− BMMs and preosteoclasts. (A) Histologic sections of 10-d-old tibiae were stained for TRAP activity. The results showed few osteoclasts and weak TRAP activity in RGS10−/− mice (arrows). (B) Quantitative analysis of TRAP+-stained area in wild-type and very weak TRAP+-stained area in RGS10−/− mice tibia sections expressed as the percentage of TRAP+-stained area versus total marrow space. N = 3; (*) P < 0.01, significant difference from wild type (student’s t-test). (C–F) BMMs from wild-type and RGS10−/− mice were incubated with RANKL/M-CSF (C,D) or with coculture system (E,F) as described in Materials and Methods. TRAP+ MNCs could be detected at 96 h in the wild-type cell culture by TRAP staining analysis, while scarcely any were detected in RGS10−/− cells. (G) Immunostaining of CD11 (Mac-1) and nonspecific esterase (NES), two monocyte/macrophage precursor cell marker genes, in RGS10+/+ and RGS10−/− tibiae. RGS10−/− mice have the same normal monocyte/macrophage as RGS10+/+ mice (arrows).
Figure 5.
Figure 5.
Impaired [Ca2+]i oscillations and NFATc1 expression in RGS10−/− BMMs induced by RANKL. (A) [Ca2+]i changes were traced in RGS10−/− or RGS10+/+ BMMs treated with RANKL/M-CSF for 72 h [Ca2+]i. Changes were estimated as the ratio of fluorescence intensity of fluo-4 to fura red, plotted at 5-sec intervals. Each color indicates a different cell in the same field. [Ca2+]i oscillations are impaired in RGS10−/− cells. (B–D) BMMs from RGS10−/− or RGS10+/+ mice were stimulated with RANKL/M-CSF for 96 h. (B) Western blot analysis showed weak signals of NFATc1 protein detected in RGS10−/− cells as compared with RGS10+/+ cells. (C) The bands in B were quantified. NFATc1 signals in RGS10−/− cells are 18-fold lower than those in RGS10+/+ cells. Data are presented as mean ± SD. N = 3 (student’s t-test). (*) P < 0.001, RGS10−/− versus RGS10+/+. (D) Immunostaining revealed that the expression of NFATc1 was impaired in RGS10−/− cells. (E–G) RANKL- and M-CSF-induced NF-κB, Erk, and c-Fos signaling are unaltered in RGS10−/− osteoclastic cells. (E) NF-κB activation in response to RANKL was assessed by Western blot analysis of IκB-α degradation in BMMs derived from RGS10+/+ or RGS10−/− mice. β-actin levels were used as loading control (n = 3). (F) M-CSF signaling in BMMs derived from RGS10+/+ or RGS10−/− mice was determined by Western blot analysis of the phosphorylated p42/p44 form of Erk at the indicated times. β-actin levels were used as loading control (n = 3). (G) Expression of c-Fos was determined by RT–PCR in day 2 osteoclasts stimulated with M-CSF for the indicated time. GAPDH levels were used as loading control (n = 3).
Figure 6.
Figure 6.
Rescue of RGS10−/− osteoclast differentiation by reintroduction of RGS10 and NFATc1 and increase in sensitivity of osteoclast differentiation to RANKL signaling by RGS10 overexpression. (A) The BMMs from RGS10+/+ and RGS10−/− mice were infected with plenti-LacZ and plenti-RGS10. Immunostaining results showed that 90% of the cells expressed RGS10 in plenti-RGS10-infected RGS10+/+ and RGS10−/− cells. (B) Western blot results confirmed the expression of RGS10 in plenti-RGS10-infected RGS10+/+ and RGS10−/− BMMs. (C) The BMMs from RGS10+/+ and RGS10−/− mice were infected with plenti-LacZ as a positive control and negative control, respectively. plenti-RGS10-infected BMMs and two controls were induced with RANKL/M-CSF as described in Materials and Methods. The cells were stained for TRAP activity. Note that some TRAP+ cells are multinucleated in plenti-RGS10-transfected RGS10−/− cells and have bone resorption activity on dentine slices (immunostaining of anti-collagen I protein; bone resorption areas become brown or dark brown), indicating that overexpression of RGS10 could rescue osteoclastogenesis. (D) Quantitative analysis of TRAP or collagen I-positive area in C expressed as the percentage of the positive stained area versus total area. Data are presented as mean ± SD. N = 3. For TRAP staining, P < 0.001 (*), Mu-plenti-LacZ versus Mu-plenti-RGS10; P > 0.05 (**), WT-plenti-LacZ versus Mu-plenti-RGS10. For immunostaining of collagen I protein, P < 0.001 (#), Mu-plenti-LacZ versus Mu-plenti-RGS10; P > 0.05 (##), WT-plenti-LacZ versus Mu-plenti-RGS10 (ANOVA). (E) The BMMs from wild-type mice were infected with plenti-LacZ or plenti-RGS10 and then treated with 0, 5, and 10 ng/mL RANKL in the presence of 10 ng/mL M-CSF for 96 h. (Bottom left panel) Without RANKL induction, 8% of precursor cells differentiated into mononuclear TRAP+ cells in plenti-RGS10-infected cells. In the presence of 5 or 10 ng/mL RANKL and 10 ng/mL M-CSF (middle and right panels), there are 3.6-fold and 3.2-fold more mononuclear and mature multinuclear TRAP+ cells, respectively, in the plenti-RGS10 group (bottom panels) compared with the plenti-LacZ group (top panels). (F) Quantitative analysis of TRAP+ cells in E. N = 3 (student’s t-test). plenti-LacZ versus plenti-RGS10 at 0 ng/mL ([*] P < 0.05), 5 ng/mL ([**] P < 0.001), and 10 ng/mL ([#] P < 0.001). (G) Western blot of NFATc1 protein in RGS10+/+ and RGS10−/− BMMs expressing pBMN-NFATc1 or control pBMN-GFP. Overexpression of NFATc1 rescues its expression in RGS10−/− BMMs. (H) NFATc1 and GFP expression in BMMs transfected with pBMN-NFATc1 or pBMN-GFP. Ninety-eight percent of transfected cells become GFP+ cells. pBMN-NFATc1 transfection induces expression of NFATc1 without RANKL induction. (I) TRAP stain of wild-type and RGS10 mutant (MU) BMMs with (panels 2,4) or without (panels 1,3) RANKL induction and with (panels 3,4) or without (panels 1,2) transfection with pBMN-NFATc1. (Bottom, panels 3,4) Overexpression of NFATc1 rescues osteoclast formation with or without RANKL induction. (J) Quantitative analysis of TRAP+ cells in I. Data are presented as mean ± SD. N = 3. (*) P < 0.001, WT−R+,N− versus Mu− R+,N−; (**) P < 0.05, WT−R−,N+ versus Mu− R−,N+; (#) P < 0.05, WT−R+,N+ versus Mu− R+,N+. (R) RANKL; (N) overexpression of NFATc1; (+) presence; (−) absence.
Figure 7.
Figure 7.
Calmodulin and PIP3 competitively bind with RGS10 in a Ca2+-dependent manner and RGS10 acts downstream from ITAM and upstream of calcineurin in the RANKL-PLCγ-[Ca2+]i oscillation–calcineurin–NFATc1 pathway. (A) Western blot analysis of activation of ITAM molecules DAP12 and FcRγ by RANKL. Phosphorylation of DAP12 and FcRγ was the same in RGS10+/+ and RGS10−/− BMMs. (B) The effect of FK506 on osteoclastogenesis induced by ectopic RGS10 expression in RGS10+/+ and RGS10−/− BMMs. FK506 (1 μg/mL) inhibited osteoclast differentiation from RANKL-induced RGS10+/+ BMMs infected by plenti-LacZ (panel 2) as compared with the culture without FK506 (panel 1). (Panel 3) As a control, FK506 inhibited the formation of TRAP+ mononuclear cells in RGS10+/+ BMMs driven by RGS10 ectopic expression with RANKL induction. (Panel 4) FK506 inhibited the formation of TRAP+ mononuclear cells as shown in the bottom left panel of Figure 6E in RGS10+/+ BMMs driven by RGS10 ectopic expression without RANKL induction. (Panel 5) FK506 inhibited the rescue effect of RGS10 reintroduction as shown in the right panel of Figure 6C in RANKL-induced RGS10−/− BMMs infected with plenti-RGS10. (C) Quantitative analysis of TRAP+ cells in A. (D) Coimmunoprecipitation of RGS10 and calmodulin. (Lanes 1,2) No interaction was observed without RANKL induction. (Lane 3) Calmodulin bound to RGS10 in the presence of 1 mM CaCl2. (Lane 4) This interaction was blocked by 0.5 mM EGTA. (Lane 5) With an additional 2 mM CaCl2, the interaction between calmodulin and RGS10 was rescued. (E) Western blot analysis of activation of PLCγ with RANKL induction or with RANKL and PI3 kinase inhibitor LY294002. (Lanes 4,5) Phosphorylation of PLCγ does not occur in BMMs treated with LY294002. (F) PIP3 bead-binding assay. RGS10 was not detected with control beads without PIP3 (negative control, lane 1) or with M-CSF induction alone (lane 2). (Lane 3) RGS10 was detected with RANKL induction (positive control). (Lane 4) RGS10 was detected after PIP3 pull-down. (Lane 5) The addition of 2 mM EGTA, which removes free Ca2+, had no effect on PIP3/RGS10 binding. (Lane 6) When 1mM CaCl2 was added to the assay, allowing it to form a complex with calmodulin, PIP3/RGS10 binding was blocked. (Lane 7) The addition of 10 μM calmodulin also blocked PIP3/RGS10 binding. (G) The working model for RGS10-mediated modification of intracellular [Ca2+]i oscillations in osteoclast differentiation.

Similar articles

Cited by

References

    1. Abramow-Newerly M., Roy A.A., Nunn C., Chidiac P., Roy A.A., Nunn C., Chidiac P., Nunn C., Chidiac P., Chidiac P. RGS proteins have a signalling complex: Interactions between RGS proteins and GPCRs, effectors, and auxiliary proteins. Cell. Signal. 2006;18:579–591. - PubMed
    1. Appleton C.T., James C.G., Beier F., James C.G., Beier F., Beier F. Regulator of G-protein signaling (RGS) proteins differentially control chondrocyte differentiation. J. Cell. Physiol. 2006;207:735–745. - PubMed
    1. Baumeister W., Walz J., Zuhl F., Seemuller E., Walz J., Zuhl F., Seemuller E., Zuhl F., Seemuller E., Seemuller E. The proteasome: Paradigm of a self-compartmentalizing protease. Cell. 1998;92:367–380. - PubMed
    1. Boyle W.J., Simonet W.S., Lacey D.L., Simonet W.S., Lacey D.L., Lacey D.L. Osteoclast differentiation and activation. Nature. 2003;423:337–342. - PubMed
    1. Cunningham M.L., Waldo G.L., Hollinger S., Hepler J.R., Harden T.K., Waldo G.L., Hollinger S., Hepler J.R., Harden T.K., Hollinger S., Hepler J.R., Harden T.K., Hepler J.R., Harden T.K., Harden T.K. Protein kinase C phosphorylates RGS2 and modulates its capacity for negative regulation of Gα 11 signaling. J. Biol. Chem. 2001;276:5438–5444. - PubMed

Publication types

MeSH terms