. 2007 Oct 1;110(7):2484-93.
doi: 10.1182/blood-2007-02-076364. Epub 2007 Jul 12.

Natural killer cells trigger differentiation of monocytes into dendritic cells

Affiliations

Natural killer cells trigger differentiation of monocytes into dendritic cells

Angela L Zhang et al. Blood. .

Abstract

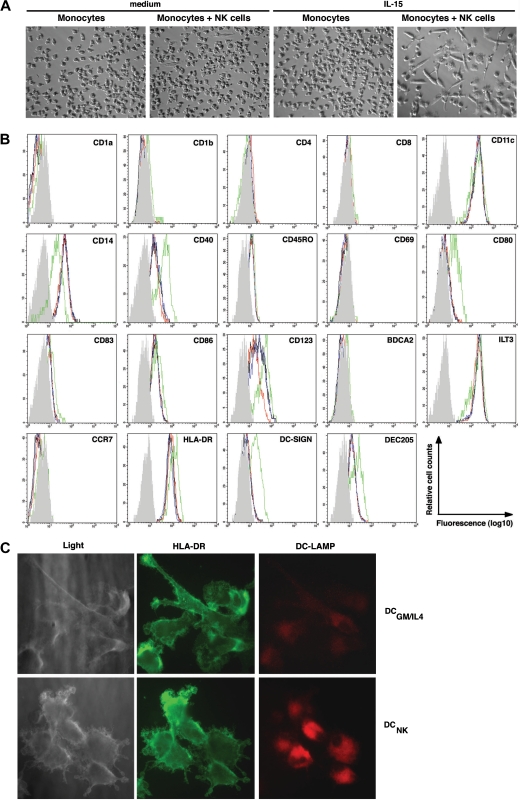
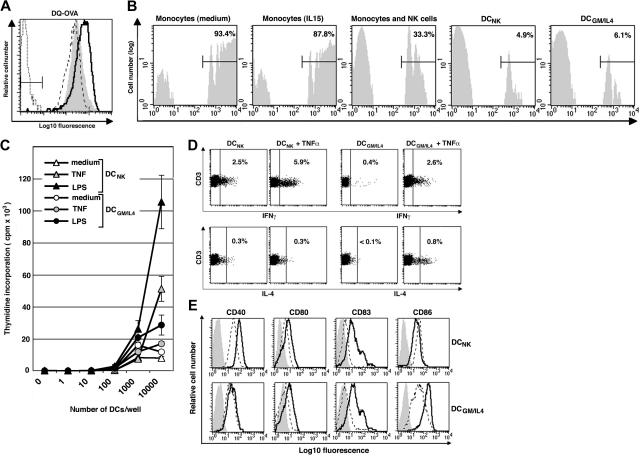
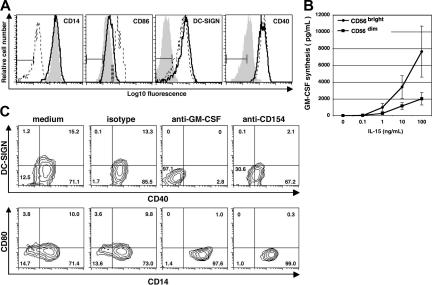
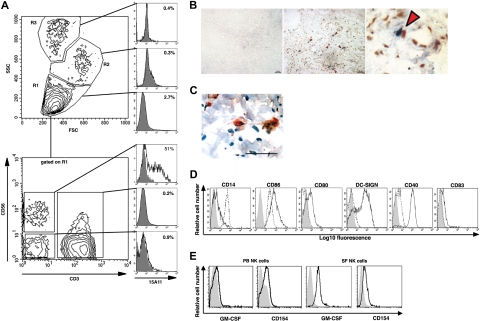
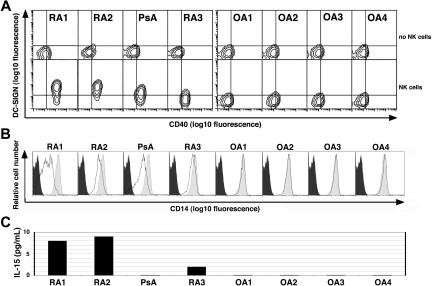
Circulating monocytes can differentiate into dendritic cells (moDCs), which are potent inducers of adaptive immune responses. Previous reports show that granulocyte macrophage-colony-stimulating factor (GM-CSF) and interleukin-4 induce monocyte differentiation into moDCs in vitro, but little is known about the physiological requirements that initiate moDC differentiation in vivo. Here we show that a unique natural killer (NK) cell subset (CD3(-)CD56(bright)) that accumulates in lymph nodes and chronically inflamed tissues triggers CD14(+) monocytes to differentiate into potent T-helper-1 (T(H)1) promoting DC. This process requires direct contact of monocytes with NK cells and is mediated by GM-CSF and CD154 derived from NK cells. It is noteworthy that synovial fluid (SF) from patients with rheumatoid arthritis (RA) and psoriatic arthritis (PsA), but not osteoarthritis (OA), induces monocytes to differentiate into DC. However, this process occurs only in the presence of NK cells. We propose that NK cells play a role in the maintenance of T(H)1-mediated inflammatory diseases such as RA by providing a local milieu for monocytes to differentiate into DC.


Figures

Figure 1
Figure 1
IL-15–stimulated NK cells induce monocyte differentiation into DCNK in vitro. (A) Phase contrast microscopy (original magnification, ×100; 10×/0.30 phase objective lens) pictures showing (left to right): monocytes cultured for 6 days in medium alone, monocytes cocultured with NK cells in medium alone, monocytes cultured in the presence of IL-15, or monocytes cultured with NK cells in the presence of IL-15, as indicated on the top of each picture. Images were acquired at 25°C using the equipment described in “Antibodies, enzyme-linked immunosorbent assay, and immunofluorescence,” are representative of 5 separate experiments. (B) Histograms show the phenotype of monocytes after culture in medium alone (black line), or in the presence of IL-15 (blue line), and monocytes that have been cocultured with NK cells in medium alone (red line), or in the presence of IL-15 (green line). The gray histogram represents the isotype control staining of monocytes that have been cocultured with NK cells in the presence of IL-15 (ie DCNK). The data are representative of 3 separate experiments. (C) Light microscopy (left panels) of DCs generated from monocytes upon NK-cell coculture (DCNK bottom) or DCs generated from monocytes in the presence of GM-CSF and IL-4 (DCGM/IL4 top). The DCs were surface stained with anti–HLA-DR (FITC, middle panels) and intracellular DC-LAMP (PE, right panels) and imaged by fluorescence microscopy (original magnification, ×630; 63×/1.40-0.60 oil-immersion objective lens). The results shown are representative of 2 separate experiments.
Figure 2
Figure 2
The CD56bright NK-cell subset in PB is mainly responsible for mediating monocyte differentiation into DCs. The CD56bright and CD56dim PB-NK-cell subsets were sorted as shown in the contour graphs (top panels). The purified NK-cell subsets were thereafter cocultured with CD14+ monocytes in the presence of IL-15 at a 10:1 ratio (monocyte/NK cell) for 6 days. Cell surface expression of CD14, CD86, CD80, DC-SIGN, CD40, and CD83 was analyzed after monocyte culture in the presence of IL-15 alone (filled dark gray histogram) or after coculture with CD56bright NK cells (solid line) or with CD56dim NK cells (dotted line). The filled light gray histograms show the isotype control stainings. Data are representative of 3 separate experiments.
Figure 3
Figure 3
DCNK take up antigen by endocytosis, lose phagocytic capacity, and exhibit potent T-cell stimulatory ability. (A) Antigen uptake by endocytosis as assessed by adding DQ-OVA to monocytes cultured in medium alone (filled gray histogram) or in the presence of GM-CSF and IL-4 (- - -), or monocytes cocultured with an NK-cell clone (). Cells were incubated with DQ-OVA overnight and subsequently analyzed by flow cytometry. A combined gate was set on monocytes/DCs based on their CD56 and FSC:SSC profiles. The histogram of NK cells alone (using a combined gate of CD56+ and FSC:SSC) is shown to indicate the fluorescence intensity of nonendocytic NK cells (· · ·). (B) Phagocytic activity, as measured by uptake of FITC-conjugated latex beads of monocytes cultured in medium alone, with IL-15, with NK cells in medium alone (monocytes NKs cells), NK cells and IL-15 (DCNK), or GM-CSF and IL-4 (DCGM/IL4). A combined gate was set on monocytes/DCs based on their CD56 and FSC:SSC profiles. Percentages indicate phagocyte activity. Results are representative of 2 separate experiments. (C) DCNK induce potent proliferation of naive allogeneic CD4+ T cells. DCGM/IL4 (circles) and DCNK (triangles) were isolated on day 6 and stimulated with TNFα (gray, 10 ng/mL), LPS (black, 1 μg/mL), or left in medium alone overnight (white). The DC were thereafter irradiated (3000 rad) and incubated at graded doses with naive CD4+ T cells as indicated. After 7 days, the cells were pulsed with [3H]thymidine and proliferation is expressed in counts per minute (cpm) × 103 (mean ± SD of triplicate cultures). (D) DCNK or DCGM/IL4 were stimulated overnight with either 10 ng/mL TNFα or medium alone before coculture with T cells (1:1 ratio) as indicated. Assessment of intracellular IFNγ (top) and IL-4 (bottom) was done using PE-conjugated anti-IFNγ and anti–IL-4 mAbs after a 72-hour culture, and the percentages of cytokine positive cells are indicated in each dot plot. IFNγ or IL-4 produced by T cells without DC stimulation, or by monocyte stimulation, was less than 0.1%. The vertical line is set to indicate the background of the isotype control staining. Results are representative of 3 separate experiments. (E) Phenotypic maturation of DCNK (top panels) and DCGM/IL4 (bottom panels). Parallel cultures of DCNK and DCGM/IL4 were harvested on day 6 and stimulated with 10 ng/mL TNFα, or kept in medium alone, for an additional 48 hours. Cell surface expression of CD40, CD80, CD83, and CD86 on TNFα-matured DC () is compared with immature DC (- - -). Gray histograms show staining with isotype control antibody.
Figure 4
Figure 4
Differentiation of DCNK depends on direct contact between NK cells and monocytes and is mediated by GM-CSF and CD40L expressed by NK cells. (A) CD14+ monocytes were cultured in medium alone (filled gray histogram), in direct contact with NK cells (- - -), or with NK cells on opposite sides of a transwell membrane (). Cells were stained on day 6 using mAb against CD14, CD86, DC-SIGN and CD40. A combined gate was set on monocytes/DCs based on the FSC:SSC profiles and NK cells were excluded from this gate. Results are representative of 3 separate experiments. (B) Isolated CD56bright (•) and CD56dim NK cells (■) derived from PB were cultured at 105 cells/well for 72 hours in medium alone, or in the presence of various concentrations of IL-15 as indicated. GM-CSF in the cell-free culture supernatant was measured by ELISA. The data show mean (± SD) of 3 separate experiments. (C) CD14+ monocytes were cocultured with autologous NK cells in medium alone, or medium containing mouse IgG1 isotype control Ab, or in the presence of neutralizing mAb against either GM-CSF or CD154 as indicated on the top of each contour graph. Cells were stained on day 6 using mAb against DC-SIGN, CD40, CD80, and CD14. A combined gate was set on monocytes/DCs based on their CD56 and FSC:SSC profiles, and quadrants are set according to the isotype control staining. Numbers indicate percentage of cells within each quadrant. Results are representative of 2 separate experiments.
Figure 5
Figure 5
NK cells colocalize with monocytes and DCs in the RA synovium and induce differentiation of CD14+ monocytes into DCNK in vitro. (A) 15A11 staining pattern on cells isolated from SF of a patient with RA. The 3 gates (ie, R1, R2, and R3) set based on FSC and SSC profiles shown on the top contour plot, and the corresponding top 3 normalized histogram overlay plots show that 15A11 primarily detects cells within a lymphocyte gated (ie R1) population. The bottom contour plot shows CD56 and CD3 expression on cells gated on SF lymphocytes (ie R1), and the corresponding 3 normalized histogram overlay plots show that 15A11 binds to 51% of SF-NK cells (CD3CD56+), whereas it shows minimal binding to SF-T cells (CD3+), or to CD3CD56 SF cells. In each histogram, the bold line indicates 15A11 staining, and the filled gray histogram indicates IgM-isotype control staining gated on respective population. An equal number of cells were used for staining with isotype and 15A11 versus CD3 and CD56. (B) The middle panel shows double staining of RA synovium using 15A11 mAb and anti-CD14 mAb. Red arrowheads indicate areas where NK cells (blue) and monocytes (red) are found in close apposition. The bar equals 50 μm. The right panel shows a higher magnification of the area marked with an asterisk in the central panel. The left panel shows staining of an adjacent RA section using isotype control antibodies. (C) Cell contact between NK cells and DCs in inflamed synovial tissue of a representative RA patient. Double staining using 15A11 mAb shows colocalization of 2 NK cells (red) with a DC-LAMP+ DC (brown). The tissue section has been counterstained with hematoxylin (blue) and the bar equals 50 μm. (D) CD14+ monocytes were cultured alone (- - -) or together with IL-15–stimulated SF NK cells (–). Cells were stained on day 3 for surface expression of CD14, CD86, CD80, DC-SIGN, CD40, and CD83 as indicated. DCs are gated based on their FSC:SSC profiles, and NK cells are excluded by gating on CD56+ cells. The filled gray histograms represent the isotype control staining. In each normalized histogram overlay, an equal number of cells were used for staining with isotype versus specific mAb. (E) NK-cell surface expression of GM-CSF and CD154 on PB CD56bright NK cells (left 2 panels) and SF NK cells (right 2 panels). NK cells maintained in IL-15 were stained with a mAb against human GM-CSF or CD154 (bold lines, as indicated) or with an isotype control Ab (filled gray histogram).
Figure 6
Figure 6
Synovial fluid derived from patients with RA and PsA, but not OA, induces monocyte differentiation into DCs in the presence of NK cells. (A) CD14+ PB monocytes derived from a healthy donor were cultured alone (top row) or together with freshly isolated autologous PB NK cells (bottom row) in medium containing 10% cell-free SF derived from patients with RA (n = 3), PsA (n = 1) or OA (n = 4) as indicated on the top. Cells were stained on day 4 for DC-SIGN and CD40. A combined gate was set on monocytes/DCs based on their CD56 and FSC:SSC profiles, and quadrants are set according to the isotype control staining. One of 2 experiments performed with similar results is shown. (B) The light gray histograms depict the CD14 levels on monocytes derived from healthy donors when cultured alone in the presence of medium supplemented with 10% cell-free SF from the patients in panel A, as indicated. The bold lines indicate the CD14 levels on cells cocultured with autologous NK cells in the presence of 10% SF as indicated. The black histogram indicates the isotype control staining of monocytes cultured in medium alone. (C) The IL-15 levels as measured by ELISA in cell-free SF derived from the patients in panel A as indicated.

Similar articles

Cited by

References

    1. Banchereau J, Steinman RM. Dendritic cells and the control of immunity. Nature. 1998;392:245–252. - PubMed
    1. Sallusto F, Lanzavecchia A. Efficient presentation of soluble antigen by cultured human dendritic cells is maintained by granulocyte/macrophage colony-stimulating factor plus interleukin 4 and downregulated by tumor necrosis factor alpha. J Exp Med. 1994;179:1109–1118. - PMC - PubMed
    1. Zhou LJ, Tedder TF. CD14+ blood monocytes can differentiate into functionally mature CD83+ dendritic cells. Proc Natl Acad Sci U S A. 1996;93:2588–2592. - PMC - PubMed
    1. Piemonti L, Bernasconi S, Luini W, et al. IL-13 supports differentiation of dendritic cells from circulating precursors in concert with GM-CSF. Eur Cytokine Netw. 1995;6:245–252. - PubMed
    1. Santini SM, Lapenta C, Logozzi M, et al. Type I interferon as a powerful adjuvant for monocyte-derived dendritic cell development and activity in vitro and in Hu-PBL-SCID mice. J Exp Med. 2000;191:1777–1788. - PMC - PubMed

Publication types

MeSH terms