

Regulation of the p27(Kip1) tumor suppressor by miR-221 and miR-222 promotes cancer cell proliferation
- PMID: 17627278
- PMCID: PMC1949005
- DOI: 10.1038/sj.emboj.7601790
Regulation of the p27(Kip1) tumor suppressor by miR-221 and miR-222 promotes cancer cell proliferation
Abstract
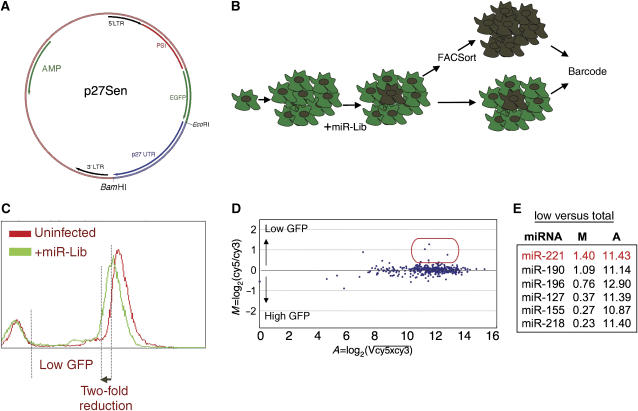
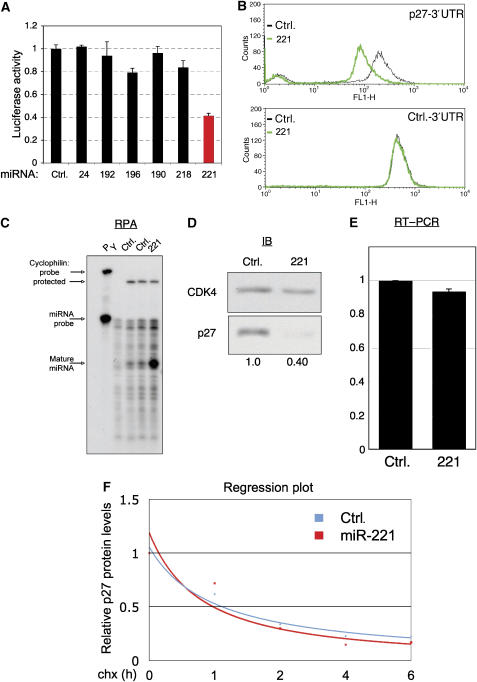
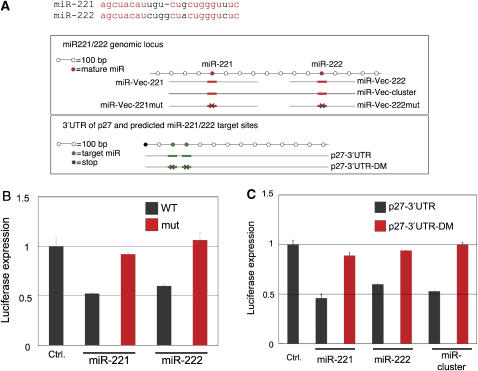
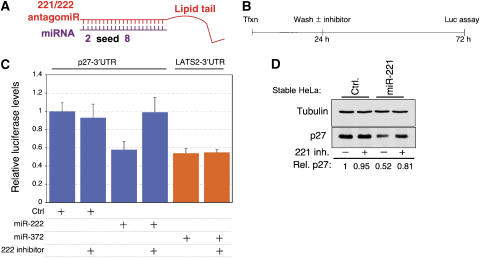
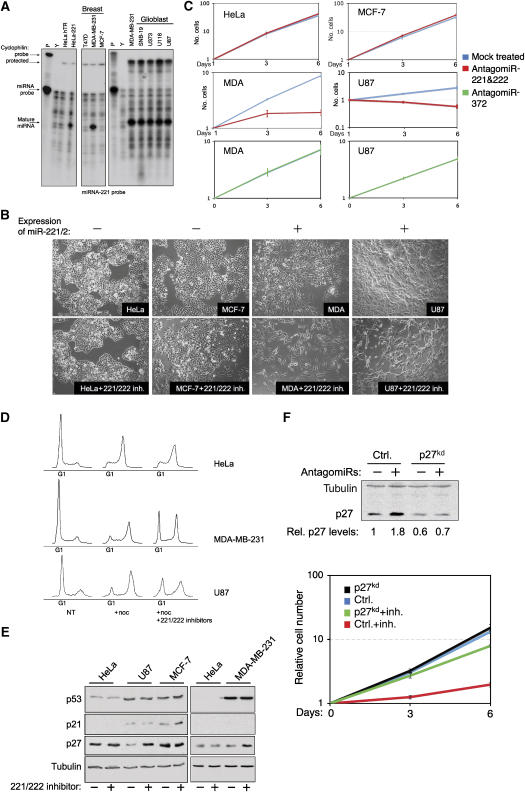
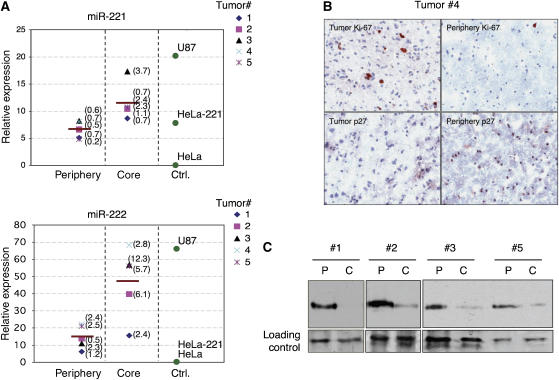
MicroRNAs (miRNAs) are potent post-transcriptional regulators of protein coding genes. Patterns of misexpression of miRNAs in cancer suggest key functions of miRNAs in tumorigenesis. However, current bioinformatics tools do not entirely support the identification and characterization of the mode of action of such miRNAs. Here, we used a novel functional genetic approach and identified miR-221 and miR-222 (miR-221&222) as potent regulators of p27(Kip1), a cell cycle inhibitor and tumor suppressor. Using miRNA inhibitors, we demonstrate that certain cancer cell lines require high activity of miR-221&222 to maintain low p27(Kip1) levels and continuous proliferation. Interestingly, high levels of miR-221&222 appear in glioblastomas and correlate with low levels of p27(Kip1) protein. Thus, deregulated expression of miR-221&222 promotes cancerous growth by inhibiting the expression of p27(Kip1).
Figures
Similar articles
-
MicroRNAs (miR)-221 and miR-222, both overexpressed in human thyroid papillary carcinomas, regulate p27Kip1 protein levels and cell cycle.Endocr Relat Cancer. 2007 Sep;14(3):791-8. doi: 10.1677/ERC-07-0129. Endocr Relat Cancer. 2007. PMID: 17914108
-
[Up-regulation of p27(kip1) by miR-221/222 antisense oligonucleotides enhances the radiosensitivity of U251 glioblastoma].Zhonghua Yi Xue Yi Chuan Xue Za Zhi. 2009 Dec;26(6):634-8. doi: 10.3760/cma.j.issn.1003-9406.2009.06.006. Zhonghua Yi Xue Yi Chuan Xue Za Zhi. 2009. PMID: 19953484 Chinese.
-
MiR-221 controls CDKN1C/p57 and CDKN1B/p27 expression in human hepatocellular carcinoma.Oncogene. 2008 Sep 25;27(43):5651-61. doi: 10.1038/onc.2008.178. Epub 2008 Jun 2. Oncogene. 2008. PMID: 18521080
-
Regulation of p27(kip1) mRNA expression by microRNAs.Prog Mol Subcell Biol. 2010;50:59-70. doi: 10.1007/978-3-642-03103-8_4. Prog Mol Subcell Biol. 2010. PMID: 19841881 Review.
-
p27(Kip1) and stathmin share the stage for the first time.Trends Cell Biol. 2005 Jul;15(7):346-8. doi: 10.1016/j.tcb.2005.05.008. Trends Cell Biol. 2005. PMID: 15951178 Review.
Cited by
-
Inhibition of p38 mitogen-activated protein kinase alters microRNA expression and reverses epithelial-to-mesenchymal transition.Int J Oncol. 2013 Apr;42(4):1139-50. doi: 10.3892/ijo.2013.1814. Epub 2013 Feb 8. Int J Oncol. 2013. PMID: 23403951 Free PMC article.
-
Gastric Carcinogenesis in the miR-222/221 Transgenic Mouse Model.Cancer Res Treat. 2017 Jan;49(1):150-160. doi: 10.4143/crt.2015.462. Epub 2016 Jun 23. Cancer Res Treat. 2017. PMID: 27338035 Free PMC article.
-
Recent advances in the molecular understanding of glioblastoma.J Neurooncol. 2012 May;108(1):11-27. doi: 10.1007/s11060-011-0793-0. Epub 2012 Jan 20. J Neurooncol. 2012. PMID: 22270850 Free PMC article. Review.
-
Gastrin-induced miR-222 promotes gastric tumor development by suppressing p27kip1.Oncotarget. 2016 Jul 19;7(29):45462-45478. doi: 10.18632/oncotarget.9990. Oncotarget. 2016. PMID: 27323780 Free PMC article.
-
Clinical significance of miR-221 and its inverse correlation with p27Kip¹ in hepatocellular carcinoma.Mol Biol Rep. 2011 Jun;38(5):3029-35. doi: 10.1007/s11033-010-9969-5. Epub 2010 Feb 10. Mol Biol Rep. 2011. PMID: 20146005
References
-
- Alessandrini A, Chiaur DS, Pagano M (1997) Regulation of the cyclin-dependent kinase inhibitor p27 by degradation and phosphorylation. Leukemia 11: 342–345 - PubMed
-
- Bagga S, Bracht J, Hunter S, Massirer K, Holtz J, Eachus R, Pasquinelli AE (2005) Regulation by let-7 and lin-4 miRNAs results in target mRNA degradation. Cell 122: 553–563 - PubMed
-
- Brummelkamp TR, Bernards R, Agami R (2002) Stable suppression of tumorigenicity by virus-mediated RNA interference. Cancer Cell 2: 243–247 - PubMed
-
- Calin GA, Croce CM (2006) MicroRNA signatures in human cancers. Nat Rev Cancer 6: 857–866 - PubMed
-
- Chilosi M, Chiarle R, Lestani M, Menestrina F, Montagna L, Ambrosetti A, Prolla G, Pizzolo G, Doglioni C, Piva R, Pagano M, Inghirami G (2000) Low expression of p27 and low proliferation index do not correlate in hairy cell leukaemia. Br J Haematol 111: 263–271 - PubMed
Publication types
MeSH terms
Substances
LinkOut - more resources
Full Text Sources
Other Literature Sources
Miscellaneous
