. 2007 Sep 1;37(3):683-93.
doi: 10.1016/j.neuroimage.2007.05.046. Epub 2007 Jun 7.

Morphometric analysis of the C57BL/6J mouse brain

Affiliations

Morphometric analysis of the C57BL/6J mouse brain

A Badea et al. Neuroimage. .

Abstract

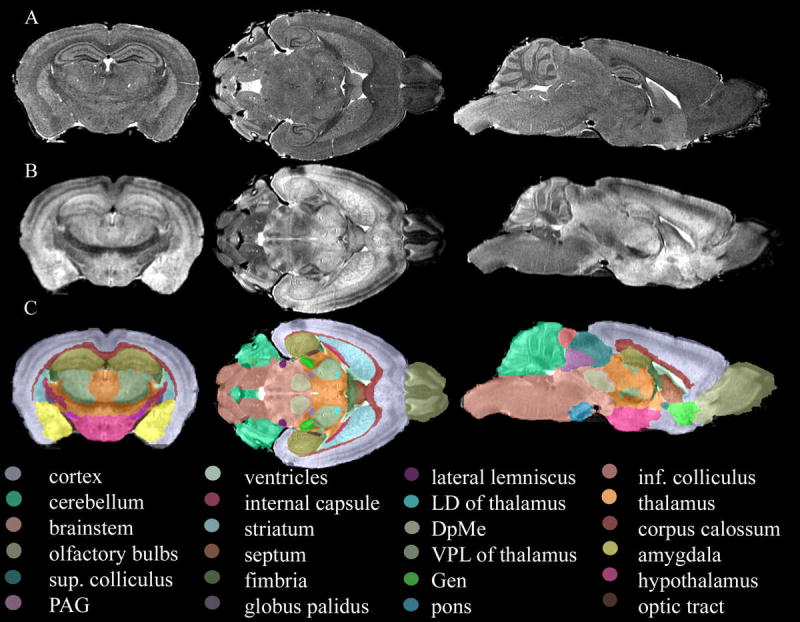
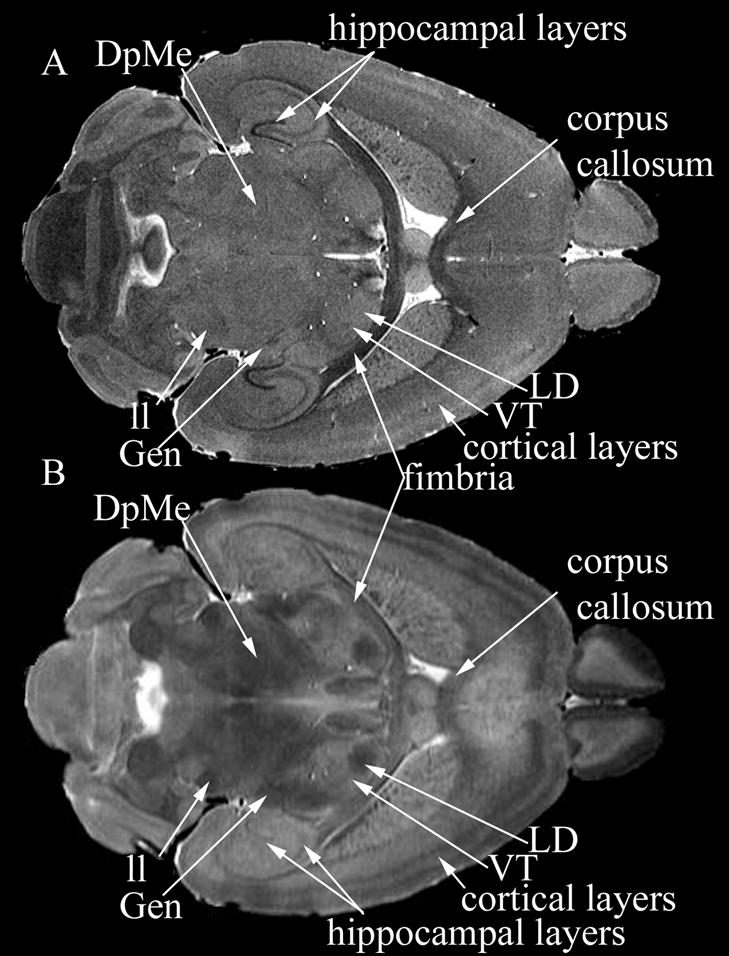
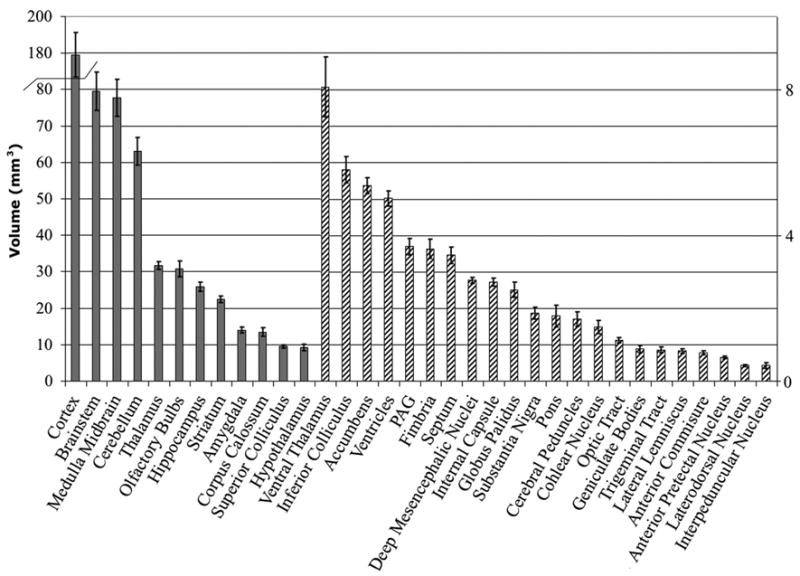
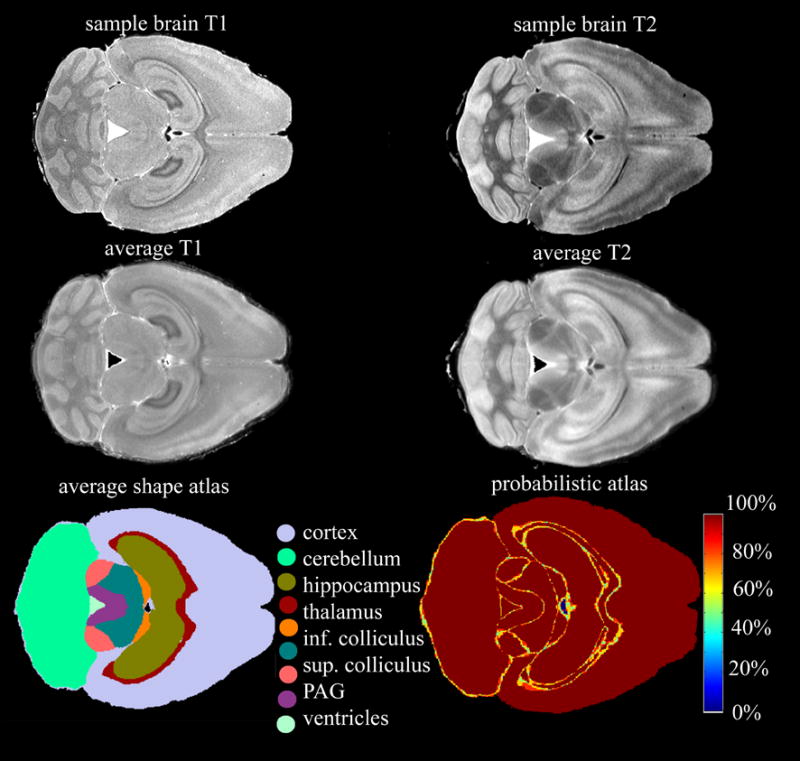
Magnetic resonance microscopy (MRM), when used in conjunction with active staining, can produce high-resolution, high-contrast images of the mouse brain. Using MRM, we imaged in situ the fixed, actively stained brains of C57BL/6J mice in order to characterize the neuroanatomical phenotype and produce a digital atlas. The brains were scanned within the cranium vault to preserve the brain morphology, avoid distortions, and to allow an unbiased shape analysis. The high-resolution imaging used a T1-weighted scan at 21.5 microm isotropic resolution, and an eight-echo multi-echo scan, post-processed to obtain an enhanced T2 image at 43 microm resolution. The two image sets were used to segment the brain into 33 anatomical structures. Volume, area, and shape characteristics were extracted for all segmented brain structures. We also analyzed the variability of volumes, areas, and shape characteristics. The coefficient of variation of volume had an average value of 7.0%. Average anatomical images of the brain for both the T1-weighted and T2 images were generated, together with an average shape atlas, and a probabilistic atlas for 33 major structures. These atlases, with their associated meta-data, will serve as baseline for identifying neuroanatomical phenotypes of additional strains, and mouse models now under study. Our efforts were directed toward creating a baseline for comparison with other mouse strains and models of neurodegenerative diseases.


Figures

Figure 1
Figure 1
Cross-sections through the T1-weighted image (A), MEFIC processed T2 image (B), and segmented volumes (C) of the same specimen. The T1-weighted image has a 21.5 μm resolution and presents a different contrast than the T2 image at 43 μm resolution, where thalamic nuclei could be identified. The combined information from both image protocols led to the identification of 33 structures (C).
Figure 2
Figure 2
Comparison of the contrasts characteristic to T1-weighted (A) and MEFIC processed T2 images (B). The T1-weighted image allowed discrimination of hippocampal layers, cortical layers, and thin white matter tracts like fimbria and corpus callosum. In the T2 image, the deep mesencephalic reticular nucleus and red nucleus (DpMe) became apparent, as well as the lateral lemniscus (ll), while the cortical layers were seen with greater contrast. Among the thalamic nuclei the geniculate nuclei (Gen), the latero-dorsal nucleus (LD), and ventral postero-lateral nucleus of the thalamus (VPL) could be identified.
Figure 3
Figure 3
Segmentation accuracy in the case of multispectral (MRF) segmentation and registration based segmentation (nlin) as reflected by the percentage voxel overlap. The average voxel overlap in the case of MRF segmentation is 85.0±7.5%, while for the purely registration based segmentation is 72.7 ±15.1%, the difference is significant where indicated with asterisks.
Figure 4
Figure 4
Volume measurements for the segmented structures. Large structures are represented on the left axis using solid colors, smaller structures are represented in the right axis using a striped pattern.
Figure 5
Figure 5
Volume coefficient of variation describes the variability of the segmented structures independently of their absolute size, which ranged from 19.8% for the interpeduncular nucleus (IP), to 3.3% for thalamus, and 2.9% for the deep mesencephalic reticular nucleus and red nucleus (DpMe).
Figure 6
Figure 6
Area measurements for the segmented structures ranged from 348.48±3.31mm2 for cortex (not shown), followed by the rest of brainstem and corpus callosum (125 ±1.60, and 120.43±6.16mm2), to 1.56±0.12 for LD (latero-dorsal nucleus of the thalamus) and 1.40 ±0.07 mm2 for interpeduncular nucleus.
Figure 7
Figure 7
Fractal dimension (FD) estimates for the segmented structures. FD is a shape characteristic that measures the degree of shape complexity, and it ranged from 2.38 for cortex to 1.24 for LD.
Figure 8
Figure 8
Shape variability expressed in terms of mean distances (MD) between the shapes or Hausdorff distances (HD). The largest values are obtained for large structures like cortex (HD: 0.77 mm, MD: 0.11 mm), thalamus, and some white matter tracts like corpus callosum, optic tract, and anterior commissure, while the smallest values are obtained for the latero-dorsal thalamic nuclei (LD) (HD: 0.04 mm, MD: 0.02 mm).
Figure 9
Figure 9
Examples of local shape characteristics evaluated using mesh representations of segmented structures. The mean shapes are pseudo-colored according to distance maps; each vertex is assigned a value equal the root mean square distance (RMS). Under each shape is represented the distance distribution, along with the minimum and maximum RMS values.
Figure 10
Figure 10
T1-weighted and T2 images (top row) are used to create average brains (middle row) and atlases (bottom row). The average shape atlas (lower row, left) is built based on nonlinear registration of the labeled datasets. The number of labels at a particular voxel location is used to build a probabilistic atlas (lower row, right). A 100% value assigned to a voxel indicates that all labels, in all brains, at that particular location are in agreement, an 80% value indicates that a minimum of 80% labels assigned at that particular location are in agreement, and so on. The low probability areas are found at the border of structures, and in regions where small structures are in close vicinity.

Similar articles

Cited by

References

    1. Ali AA, Dale AM, et al. Automated segmentation of neuroanatomical structures in multispectral MR microscopy of the mouse brain. NeuroImage. 2005;27(2):425–435. - PubMed
    1. Ashburner J. Computational Neuroanatomy. London: University College; 2000.
    1. Badea A, Kostopoulos GK, et al. Surface visualization of electromagnetic brain activity. J Neurosci Methods. 2003;127(2):137–47. - PubMed
    1. Badea A, Nicholls PJ, et al. Neuroanatomical phenotypes in the reeler mouse. Neuroimage. 2007;34(4):1363–74. - PMC - PubMed
    1. Barabasi AL, Stanley HE. Fractal Concepts in Surface Growth. Cambridge: Cambridge University Press; 1995.

Publication types