

Feeding microstructure in diet-induced obesity susceptible versus resistant rats: central effects of urocortin 2
- PMID: 17627984
- PMCID: PMC2277029
- DOI: 10.1113/jphysiol.2007.138867
Feeding microstructure in diet-induced obesity susceptible versus resistant rats: central effects of urocortin 2
Abstract
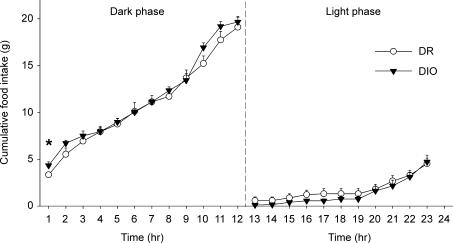
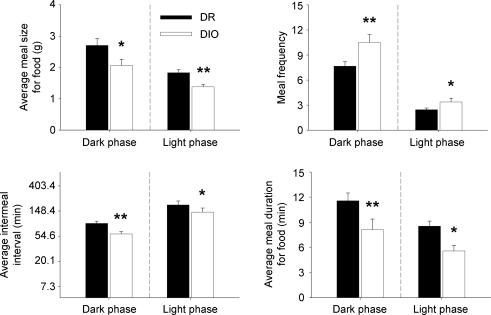
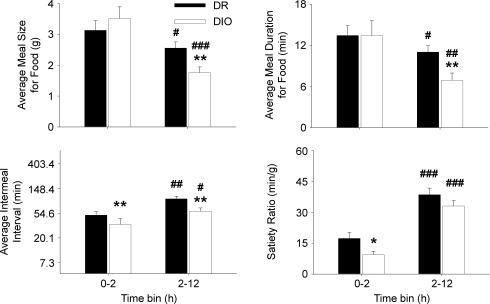
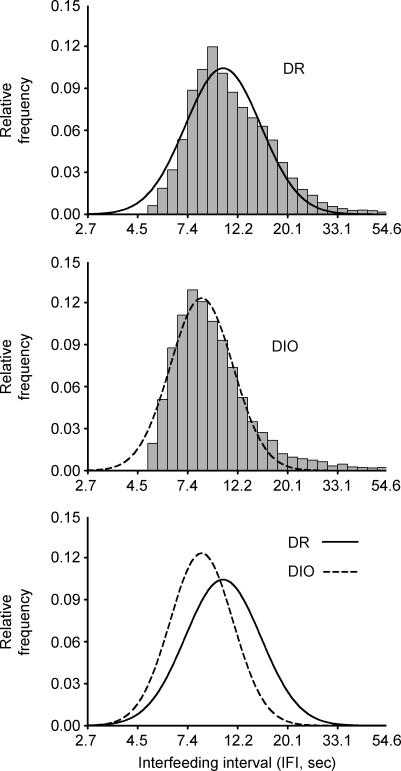
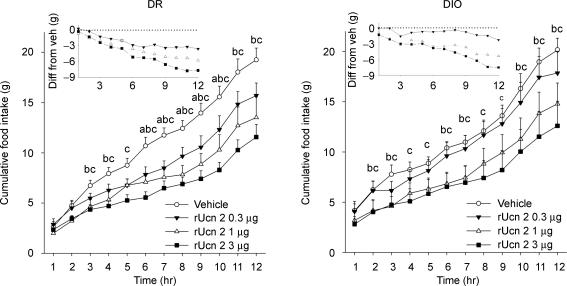
With one billion people overweight worldwide, the need to identify risk factors and treatments for obesity is urgent. The present study determined whether rats genetically prone to diet-induced obesity (DIO) show preexisting differences in meal microstructure and are sensitive to central anorectic effects of corticotropin-releasing factor type 2 (CRF(2)) receptor stimulation. Male, selectively bred DIO rats and their diet resistant (DR) counterparts (n = 9/genotype) were weaned onto low-fat chow and compared as young adults for spontaneous or intracerebroventricular urocortin 2 administration-induced (0, 0.3, 1, 3 microg) differences in ingestion. DIO rats were hyperphagic selectively at the dark cycle onset, showing shorter latencies to initiate feeding, faster returns to eating following meal completion, and a lower satiety ratio than DR rats. At other times, DIO rats had briefer postmeal intervals, but ate smaller and briefer meals, resulting in normal intake. DIO rats also ate faster than DR rats. Urocortin 2 was less potent in DIO rats, ineffective at the 0.3 microg dose, but produced CRF(2) antagonist-reversible anorexia at higher doses. Though heavier, chow-maintained DIO rats were proportionately as or more lean than DR rats. Thus, DIO rats showed signs of a preexisting, heritable deficit in the maintenance of postmeal satiety and a reduced sensitivity to anorectic CRF(2) agonist stimulation. The meal patterns of DIO rats temporally resemble human 'snacking' behaviour, which predicts adult obesity. Because central CRF(2) stimulation retains full anorectic efficacy at higher doses in the DIO model, manipulating this neuropeptidergic system might yield new therapeutic approaches for diet-induced obesity.
Figures

Similar articles
-
Centrally administered urocortin 2 decreases gorging on high-fat diet in both diet-induced obesity-prone and -resistant rats.Int J Obes (Lond). 2013 Dec;37(12):1515-23. doi: 10.1038/ijo.2013.22. Epub 2013 Mar 12. Int J Obes (Lond). 2013. PMID: 23478425 Free PMC article.
-
Delayed satiety-like actions and altered feeding microstructure by a selective type 2 corticotropin-releasing factor agonist in rats: intra-hypothalamic urocortin 3 administration reduces food intake by prolonging the post-meal interval.Neuropsychopharmacology. 2007 May;32(5):1052-68. doi: 10.1038/sj.npp.1301214. Epub 2006 Oct 4. Neuropsychopharmacology. 2007. PMID: 17019404 Free PMC article.
-
Intracerebroventricular urocortin 3 counteracts central acyl ghrelin-induced hyperphagic and gastroprokinetic effects via CRF receptor 2 in rats.Drug Des Devel Ther. 2016 Oct 3;10:3281-3290. doi: 10.2147/DDDT.S113195. eCollection 2016. Drug Des Devel Ther. 2016. PMID: 27757017 Free PMC article.
-
Nociceptin/orphanin FQ acts as a functional antagonist of corticotropin-releasing factor to inhibit its anorectic effect.Physiol Behav. 2004 Aug;82(1):63-8. doi: 10.1016/j.physbeh.2004.04.035. Physiol Behav. 2004. PMID: 15234592 Review.
-
Urocortin: a protective peptide that targets both the myocardium and vasculature.Pharmacol Rep. 2009 Jan-Feb;61(1):172-82. doi: 10.1016/s1734-1140(09)70019-2. Pharmacol Rep. 2009. PMID: 19307705 Review.
Cited by
-
Pituitary Adenylate Cyclase-Activating Peptide in the Central Amygdala Causes Anorexia and Body Weight Loss via the Melanocortin and the TrkB Systems.Neuropsychopharmacology. 2015 Jul;40(8):1846-55. doi: 10.1038/npp.2015.34. Epub 2015 Feb 4. Neuropsychopharmacology. 2015. PMID: 25649277 Free PMC article.
-
Chronic administration of brain-derived neurotrophic factor in the hypothalamic paraventricular nucleus reverses obesity induced by high-fat diet.Am J Physiol Regul Integr Comp Physiol. 2010 May;298(5):R1320-32. doi: 10.1152/ajpregu.00844.2009. Epub 2010 Feb 17. Am J Physiol Regul Integr Comp Physiol. 2010. PMID: 20164202 Free PMC article.
-
Intermittent access to preferred food reduces the reinforcing efficacy of chow in rats.Am J Physiol Regul Integr Comp Physiol. 2008 Oct;295(4):R1066-76. doi: 10.1152/ajpregu.90309.2008. Epub 2008 Jul 30. Am J Physiol Regul Integr Comp Physiol. 2008. PMID: 18667718 Free PMC article.
-
Converging vulnerability factors for compulsive food and drug use.Neuropharmacology. 2021 Sep 15;196:108556. doi: 10.1016/j.neuropharm.2021.108556. Epub 2021 Apr 20. Neuropharmacology. 2021. PMID: 33862029 Free PMC article. Review.
-
Small changes in meal patterns lead to significant changes in total caloric intake. Effects of diet and social status on food intake in female rhesus monkeys.Appetite. 2013 Mar;62:60-9. doi: 10.1016/j.appet.2012.11.011. Epub 2012 Nov 30. Appetite. 2013. PMID: 23207191 Free PMC article.
References
-
- Adan R. Preface. Eur J Pharmacol. 2002;440:83.
-
- Arase K, Shargill NS, Bray GA. Effects of corticotropin releasing factor on genetically obese (fatty) rats. Physiol Behav. 1989a;45:565–570. - PubMed
-
- Arase K, Shargill NS, Bray GA. Effects of intraventricular infusion of corticotropin-releasing factor on VMH-lesioned obese rats. Am J Physiol Regul Integr Comp Physiol. 1989b;256:R751–R756. - PubMed
-
- Bale TL, Anderson KR, Roberts AJ, Lee KF, Nagy TR, Vale WW. Corticotropin-releasing factor receptor-2-deficient mice display abnormal homeostatic responses to challenges of increased dietary fat and cold. Endocrinology. 2003;144:2580–2587. - PubMed
-
- Berteus Forslund H, Torgerson JS, Sjostrom L, Lindroos AK. Snacking frequency in relation to energy intake and food choices in obese men and women compared to a reference population. Int J Obesity. 2005;29:711–719. - PubMed
Publication types
MeSH terms
Substances
Grants and funding
LinkOut - more resources
Full Text Sources
Research Materials