. 2007 Sep 1;583(Pt 2):631-46.
doi: 10.1113/jphysiol.2007.136630. Epub 2007 Jul 12.

Genetic deletion of SK2 channels in mouse inner hair cells prevents the developmental linearization in the Ca2+ dependence of exocytosis

Affiliations

Genetic deletion of SK2 channels in mouse inner hair cells prevents the developmental linearization in the Ca2+ dependence of exocytosis

Stuart L Johnson et al. J Physiol. .

Abstract

Inner hair cells (IHCs), the primary sensory receptors of the mammalian cochlea, fire spontaneous Ca(2+) action potentials (APs) only before the onset of hearing. Although a role for APs in the developing auditory system has not been determined it could, by analogy with other sensory systems, guide the functional maturation of the cochlea before experience-driven activity begins. Spontaneous APs in immature IHCs are shaped by a variety of ion channels including that of the small conductance Ca(2+)-activated K(+) current (SK2), which is only transiently expressed in immature cells. Using SK2 knockout mice we found that SK2 channels are not required for generating APs but are essential for sustaining continuous repetitive spontaneous AP activity in pre-hearing IHCs. Therefore we used this mutant mouse as a model to study possible developmental implications of disrupted AP activity. Immature mutant IHCs showed impaired exocytotic responses, which are likely to be due to the expression of fewer Ca(2+) channels. Exocytosis was also impaired in adult mutant IHCs, although in this case it resulted from a reduced Ca(2+) efficiency and increased Ca(2+) dependence of the synaptic machinery. Since SK2 channels can only have a functional influence on IHCs during immature development and are not directly involved in neurotransmitter release, the altered Ca(2+) dependence of exocytosis in adult IHCs is likely to be a consequence of their disrupted AP activity at immature stages.


Figures

Figure 1
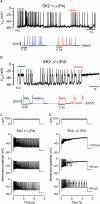
Figure 1. Repetitive spontaneous action potentials in immature IHCs require ISK2
A, spontaneous voltage responses (25 s) from a control (+/+) IHC. AP frequency: 2.7 Hz. The two insets show expanded regions of the trace above (blue and red horizontal lines). t = 20 s indicates the time from the beginning of the recording. B, currents in voltage clamp from control (+/+), mutant (Δ/Δ) and control superfused with 300 nm apamin (+/+ and Apa). Recordings were in response to a voltage step from −84 mV to −34 mV. Note the presence of the slowly activating ISK2(arrow) only in the +/+ IHC. C, spontaneous APs from a mutant (Δ/Δ) IHC. Spike frequency: 4.2 Hz (left panel) and 2.4 Hz (right panel). The time specified at the break point along the trace represents the actual time omitted from the recording, i.e. 52 s is the time that the cell remained depolarized, 1 s transition to the resting potential and 74 s time before trace resumes. D, APs from a control IHC during the superfusion of apamin. AP frequency: 3.2 Hz and 2.5 Hz. E, APs from different time points (colour coded) shown in panels A, C and D. F, AP width as a function of recording time for the cells shown above. Cell properties were, +/+: Cm 7.6 pF; Rs 6.1 MΩ; gleak 1.4 nS; Δ/Δ: Cm 8.9 pF; Rs 6.8 MΩ; gleak 1.6 nS. +/+ and Apa: Cm 8.4 pF; Rs 7.8 MΩ; gleak 1.9 nS. All recordings in this and following figures were obtained at body temperature and are single traces.
Figure 2
Figure 2. SK2 is also essential for sustaining induced action potentials
A–C, voltage responses induced by depolarizing current injections from control (+/Δ, A), mutant (Δ/Δ, B) and control with 300 nm apamin (+/+ and Apamin, C) immature IHCs. Current steps were applied between 0 pA and +100 pA from the resting potential, and for clarity only a few responses are shown (see values next to panels in C). Recordings of injected currents are shown above the voltage traces. Subsequent current steps were separated by about 5 s. Arrowheads in A indicate a more robust AP repolarization most likely caused by the SK2 current. +/Δ: Cm 8.8 pF; Rs 5.1 MΩ; gleak 1.0 nS; Δ/Δ: not known. +/+ and Apa: Cm 9.1 pF; Rs 1.9 MΩ.
Figure 3
Figure 3. Action potentials in immature IHCs under perforated patch conditions
A, spontaneous voltage responses (8.5 s) from a control (+/Δ) IHC. AP frequency: 6.4 Hz. The two insets show expanded regions of the trace above. Cm 10.4 pF; Rs 3.4 MΩ. B, spontaneous APs from a mutant (Δ/Δ) IHC. Spike frequency: 3.5 Hz. Cm 7.5 pF; Rs 7.3 MΩ. t = 0 in both A and B indicates the time from the beginning of the recording (immediately after membrane perforation). C and D, evoked voltage responses elicited using depolarizing current injections from control and mutant immature IHCs, respectively. Current-clamp protocol shown above the traces. +/Δ: Cm 9.1 pF; Rs 6.2 MΩ; Δ/Δ: 7.1 pF; Rs 5.8 MΩ.
Figure 4
Figure 4. Membrane currents in immature IHCs
A and B, membrane currents recorded from a control (A) and a mutant (B) P3 IHC. Currents were elicited by hyperpolarizing and depolarizing voltage steps (10 mV nominal increments) from −84 mV. Actual test potentials, corrected for voltage drop across uncompensated Rs, are shown next to some of the traces. Note the presence of both Ca2+ and Na+ currents preceding the slower activating K+ current IK,neo (Marcotti et al. 2003a, 2003b). +/Δ: Cm 7.7 pF; Rs 3.8 MΩ; gleak 2.0 nS. Δ/Δ: Cm 7.4 pF; Rs 1.3 MΩ; gleak 1.3 nS. C, average steady-state current–voltage (I–V) curves for IK,neo obtained from 12 control and 7 mutant IHCs, including those shown in A and B. D and E, inwardly rectifying K+ current (IK1: Marcotti et al. 1999) in control and mutant IHCs, respectively. Current responses are from P3 IHCs recorded by using 10 mV voltage steps nominally between −44 mV and −54 mV starting from a holding potential of −64 mV. +/Δ: Cm 7.4 pF; Rs 4.6 MΩ; gleak 2.0 nS. Δ/Δ: Cm 8.1 pF; Rs 1.6 MΩ; gleak 0.6 nS. F, average I–V curves at the steady-state currents (IK,1) from control (n = 3) and mutant (n = 4) IHCs, including those shown in D and E.
Figure 5
Figure 5. Membrane currents and voltage responses in adult IHCs
A and B, membrane currents recorded from a control (A) and a mutant (B) adult IHC (P20). Currents were elicited by hyperpolarizing and depolarizing voltage steps (10 mV nominal increments) from −64 mV. Note the presence of all three K+ currents characteristic of adult IHCs (IK,s, IK,n and IK,f). +/Δ: Vm−76 mV; Cm 13.5 pF; Rs 1.4 MΩ; gleak 1.3 nS. Δ/Δ: Vm−72 mV; Cm 13.8 pF; Rs 1.0 MΩ; gleak 1.5 nS. C, average steady-state current-voltage (I–V) curves obtained from 4 control and 5 mutant IHCs, including those shown in A and B. D and E, voltage responses under current clamp from +/Δ (D) and Δ/Δ (E) IHCs. Current steps were applied between −20 pA and +2000 pA, from the resting potential. +/Δ: Vm−72 mV; Cm 10.8 pF; Rs 1.1 MΩ; gleak 1.2 nS. Δ/Δ: same cell as in B. F, size of IK,n in +/Δ and Δ/Δ IHCs measured as the deactivating tail currents at −124 mV (difference between instantaneous and steady-state inward currents) from the holding potential of −64 mV. G, size of IK,s and IK,f in +/Δ and Δ/Δ IHCs was measured by using a voltage step to −25 mV from the holding potential of −84 mV. IK,f was measured at 1.0–1.5 ms from the start of the voltage step, a time point at which IK,s is not active (Marcotti et al. 2004a). IK,s was obtained by subtracting IK,f from the total outward current (IK,f+IK,s) measured at 160 ms. H, resting membrane potential in control and mutant IHCs. Number of cells investigated in F–H are shown in line with the columns.
Figure 6
Figure 6. Ca2+ currents and ΔCm in immature IHCs from SK2 mutant mice
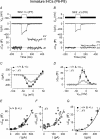
A and B, ICa (middle) and ΔCm (bottom) responses in immature control (P7 +/+) and mutant (P8 Δ/Δ) IHCs, respectively. Recordings were obtained in response to 100 ms voltage steps, in 10 mV increments, from −81 mV. For clarity, only responses at −11 mV and −81 mV are shown. The voltage protocol is shown in the top panel above the traces. +/Δ: Cm 8.5 pF; Rs 5.5 MΩ; gleak 1.4 nS. Δ/Δ: Cm 8.5 pF; Rs 5.3 MΩ; gleak 1.7 nS. C and D, average peak current–voltage (I–V) and capacitance–voltage (ΔCmV) curves from immature IHCs (+/+ and +/Δ, n = 11; Δ/Δ, n = 8). E and F, synaptic transfer functions describing the relation between ΔCm and ICa were obtained by plotting average ΔCm against the corresponding ICa from the I–V (C) and ΔCmV (D) curves for immature control and mutant IHCs, respectively. Single data points are also shown (grey symbols). In this and the next figure, data plotted are from values at membrane potentials from −71 mV to −21 mV. Fits to the single grey data points are according to eqn 1. R2 of the fits were 0.9 and 0.6 in control and mutant cells. G, direct comparison of the synaptic transfer functions from control and mutant IHCs in panels E and F.
Figure 7
Figure 7. Ca2+ currents and ΔCm in adult SK2 mutant IHCs
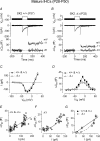
A and B, ICa and ΔCm responses in adult control (+/+ P37) and mutant (Δ/Δ P32) IHCs, respectively. Recordings were obtained as described for Fig. 6. +/+: Cm 8.3 pF; Rs 4.1 MΩ; gleak 1.9 nS. Δ/Δ: Cm 9.2 pF; Rs 4.9 MΩ; gleak 1.0 nS. C and D, average peak I–V and ΔCmV curves, respectively, from adult IHCs (+/+ and +/Δ: P28–P50, n = 13; Δ/Δ: P31–P49, n = 9). E and F, synaptic transfer functions of adult control and mutant IHCs, respectively. Single data points are shown in grey. Fits to single data points are according to eqn (1). R2 was 0.7 and 0.9 in control and mutant cells. G, direct comparison of the synaptic transfer functions from control and mutant IHCs in panels E and F.
Figure 8
Figure 8. Ca2+ dependence of exocytosis in adult IHCs
A and B, ICa and ΔCm responses from a control and mutant IHC during the application of different Ca2+ concentrations. +/Δ: Cm 10.7 pF; Rs 4.9 MΩ; gleak 0.7 nS. Δ/Δ: Cm 8.1 pF; Rs 5.4 MΩ; gleak 2.5 nS. C and D, average I–V (bottom) and corresponding ΔCmV (top) curves recorded using different Ca2+ concentrations from control and mutant IHCs, respectively (+/+ and +/Δ: P28–P50, n = 5; Δ/Δ: P31–P49, n = 4). Note that for clarity the values for 0 mm Ca2+ have been omitted. E and F, synaptic transfer functions of adult control and mutant IHCs, respectively. Single data values are shown in grey. For each IHC ΔCm values are plotted against the corresponding ICa recorded between −71 mV and the membrane potential where the peak current occurred in different extracellular Ca2+ concentrations. Fits to the single data points are according to eqn (1). R2 was 0.7 and 0.9 in control and mutant cells. G, direct comparison of the synaptic transfer functions from control and mutant IHCs in panels E and F.
Figure 9
Figure 9. Kinetics of neurotransmitter release in control and mutant adult IHCs
A and B, ΔCm recordings from a control (A) and a mutant (B) adult IHC in response to voltage steps (to around −11 mV) of different duration shown next to the traces. +/Δ: Cm 7.9 pF; Rs 4.7 MΩ; Δ/Δ: Cm 9.2 pF; Rs 4.9 MΩ. C, average ΔCm responses recorded for each voltage step applied (2 ms to 3 s) from control (P28–P31, n = 5) and mutant (P31–P32, n = 6) IHCs. RRP: readily releasable pool; SRP: secondarily releasable pool. D, average ΔCm responses (expanded version of the first 100 ms shown in C) approximated with a single exponential function (control: maximal ΔCm= 28 ± 2 fF, τ= 46 ± 9 ms; mutant: maximal ΔCm= 17 ± 2 fF, τ= 40 ± 13 ms). The available RRP consisted of 757 (control) and 459 (mutant) synaptic vesicles (significant at P < 0.005) using a conversion factor of 37 aF per vesicle (Lenzi et al. 1999). The initial release rate was 612 fF s−1 (16542 vesicles s−1) and 418 fF s−1 (11305 vesicles s−1) in control and mutant IHCs, respectively (not significant). E, the isolated secondarily releasable pools (where responses to the 100 ms step in C have been subtracted to zero) fitted with single exponentials (maximal ΔCm: control 189 ± 11 fF, mutant 291 ± 52 fF; τ: control 387 ± 73 ms, mutant 1163 ± 455 ms, both not significantly different) consisted of 5096 (control) and 7852 (mutant) synaptic vesicles. The initial release rates of the SRP were 487 fF s−1 (13155 vesicles s−1) and 249 fF s−1 (6732 vesicles s−1) in control and mutant IHCs, respectively. Dotted lines in D and E represent 95% confidence intervals for the fits.

Similar articles

Cited by

References

    1. Augustine GJ, Charlton MP. Calcium dependence of presynaptic calcium current and postsynaptic response at the squid giant synapse. J Physiol. 1986;381:619–640. - PMC - PubMed
    1. Augustine GJ, Charlton MP, Smith SJ. Calcium entry and transmitter release at voltage-clamped nerve terminals of squid. J Physiol. 1985;367:163–181. - PMC - PubMed
    1. Berridge MJ, Lipp P, Bootman MD. The versatility and universality of calcium signalling. Nat Rev Mol Cell Biol. 2000;1:11–21. - PubMed
    1. Beutner D, Moser T. The presynaptic function of mouse cochlear inner hair cells during development of hearing. J Neurosci. 2001;21:4593–4599. - PMC - PubMed
    1. Bond CT, Herson PS, Strassmaier T, Hammond R, Stackman R, Maylie J, Adelman JP. Small conductance Ca2+-activated K+ channel knock-out mice reveal the identity of calcium-dependent afterhyperpolarization currents. J Neurosci. 2004;24:5301–5306. - PMC - PubMed

Publication types

MeSH terms

Substances