. 2007 Aug 15;583(Pt 1):251-69.
doi: 10.1113/jphysiol.2007.136549. Epub 2007 Jul 12.

Functional groups of ryanodine receptors in rat ventricular cells

Affiliations

Functional groups of ryanodine receptors in rat ventricular cells

V Lukyanenko et al. J Physiol. .

Abstract

Ryanodine receptors (RyR2s) are ion channels in the sarcoplasmic reticulum (SR) that are responsible for Ca2+ release in rat ventricular myocytes. Localization of RyR2s is therefore crucial for our understanding of contraction and other Ca2+-dependent intracellular processes. Recent results (e.g. circular waves and Ca2+ sparks in perinuclear area) raised questions about the classical views of RyR2 distribution and organization within ventricular cells. A Ca2+ spark is a fluorescent signal reflecting the activation of a small group of RyR2s. Frequency and spatio-temporal characteristics of Ca2+ sparks depend on the state of cytoplasmic and intraluminal macromolecular complexes regulating cardiac RyR2 function. We employed electron microscopy, confocal imaging of spontaneous Ca2+ sparks and immunofluorescence to visualize the distribution of RyR2s in ventricular myocytes and to evaluate the local involvement of the macromolecular complexes in regulation of functional activity of the RyR2 group. An electron microscopy study revealed that the axial tubules of the transverse-axial tubular system probably do not have junctions with the network SR (nSR). The nSR was found to be wrapped around intermyofibrillar mitochondria and contained structures similar to feet of the junctional cleft. Treatment of ventricular myocytes with antibodies against RyR2 showed that in addition to the junctional SR, a small number of RyR2s can be localized at the middle of the sarcomere and in the zone of perinuclear mitochondria. Recordings of spontaneous Ca2+ sparks showed the existence of functional groups of RyR2s in these intracellular compartments. We found that within the sarcomere about 20% of Ca2+ sparks were not colocalized with the zone of the junctional or corbular SR (Z-line zone). The spatio-temporal characteristics of sparks found in the Z-line and A-band zones were very similar, whereas sparks from the zone of the perinuclear mitochondria were about 25% longer. Analysis of the initiation sites of Ca2+ sparks within the same junctional SR cluster suggested that 18-25 RyR2s are in the functional group producing a spark. Because of the similarity of the spatio-temporal characteristics of sarcomeric sparks and ultrastructural characteristics of nSR, we suggest that the functional groups of RyR2s in the middle of the sarcomere are macromolecular complexes of approximately 20 RyR2s with regulatory proteins. Our data allowed us to conclude that a significant number of functional RyR2s is located in the middle of the sarcomere and in the zone of perinuclear mitochondria. These RyR2s could contribute to excitation-contraction coupling, mitochondrial and nuclear signalling, and Ca2+-dependent gene regulation, but their existence raises many additional questions.


Figures

Figure 4
Figure 4
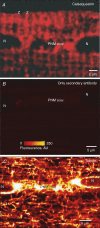
Distribution of RyR2s marked with MA3-916 (ABR) in permeabilized ventricular cells AD, immunofluorescence labelling. A and B, live cells were permeabilized with saponin in vitro. Then the cells were incubated for 30 min with (A) and without (B) primary antibody. After a 30 min washout, the cells were incubated for 30 min with secondary antibody conjugated to a fluorescent probe and again washed-out for 30 min. C and D, representative images of cells permeabilized with saponin after fixation in paraformaldehyde. The cells were incubated overnight with primary antibody. D, different region of the cell presented in C and with higher resolution. Images are deconvolved from 3-D stack. Thickness of the optical slices for C and D was ∼0.7 μm. Z-lines were marked on the images according to corresponding images in transmitted light. Z, Z-line; arrows show labelling in M band (between Z-lines); PNM, perinuclear mitochondria; N, nucleus.
Figure 5
Figure 5
Distribution of calsequestrin andα-tubulin in ventricular cells Immunofluorescence labelling. Representative images of cells permeabilized with saponin after fixation in paraformaldehyde. The cells were incubated overnight with primary polyclonal antibody against calsequestrin (A) or anti-α-tubulin (clone 12G10, (C). The primary antibody was diluted 1: 100 and the secondary (goat anti-rabbit conjugated to Alexa 488) was diluted 1: 500 (A–C). A, image is deconvolved from a 3-D stack. B, only secondary antibody was added to cells. Secondary antibody was diluted 1: 200. Z, Z-line; PNM, zone of perinuclear mitochondria; N, nucleus.
Figure 1
Figure 1
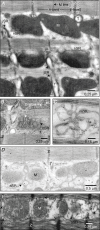
Sarcoplasmic reticulum in rat ventricular cells The electron micrographs (longitudinal ultrathin section) show ventricular cell ultrastructure using conventional fixation and polymerization in acrylic LR White Resin. A, oblique section in tissue samples shows localization of junctional SR (jSR) and network SR (nSR) in relation to T-tubules and mitochondria (M). BD, nSR. Isolated cells. B, in the centre of the micrograph nSR is seen together with mitochondrial cristae or with contractile elements. C, junctions of branches of the nSR create platforms that could carry small group of RyR2s. D, an nSR fills mitochondrial invaginations. E, oblique section through three mitochondria shows nSR wrapping around them. jSR, junctional SR; nSR, network SR; M, mitochondrion; T, T-tubule of TATS; Z, Z-line.
Figure 2
Figure 2
Distribution of possible RyR2s in rat ventricular cells The electron micrographs (longitudinal ultrathin section) show ventricular cell ultrastructure using conventional fixation and polymerization in Epon. Slightly oblique longitudinal ultrathin section, 2.5% glutaraldehyde for 3 h. Isolated intact cell. A and B, these electron micrographs show possible RyR2s that can be attributed to network (A) or junctional (B) SR. Inset at higher magnification shows the area marked with the dashed line. T, T-tubules; nSR, network sarcoplasmic reticulum; jSR, junctional SR; M, mitochondrion; Z, Z-line; arrowheads, possible RyR2s.
Figure 3
Figure 3
Axial tubule of the transverse–axial tubular system (TATS) Slightly oblique longitudinal ultrathin section, 2.5% glutaraldehyde for 3 h, Epon embedding. Isolated intact cell. This electron micrograph shows an axial tubule of TATS. Arrows show bridges between the tubule membrane and jSR (thick arrows) and outer mitochondrial membrane (marked area). Inset at higher magnification shows the area marked with dashed line. Arrows show possible contacts between axial tubule of TATS and mitochondrion. T, T-tubules; nSR, network sarcoplasmic reticulum; jSR, junctional SR; M, mitochondrion; Z, Z-line; L, lipid droplet.
Figure 6
Figure 6
Spatial distribution of BODIPY TR-X ryanodine (BTR) in permeabilized ventricular cells A, co-labelling with RyR2 antibody conjugated to Alexa Fluor 488 (blue) and 0.5 μm BTR (red). Excitation, 488 and 543 nm; emission, > 505 and > 560 nm, respectively. B, ventricular cell was pretreated for 10 min with 10 μm BTR and 5 min with 25 μm fluo-3 (pentapotassium salt). C–E, unique properties of BTR could be used to visualize Z-lines in negative relief. C, the cell was pretreated for 10 min with 5 μm BTR. D, the graph shows the average fluorescence (profile) for C. D, inverted image of distribution of BTR presented in C. Excitation/emission, 488/505 nm; optical slice < 1 μm. Z, Z-line; M, mitochondrion.
Figure 7
Figure 7
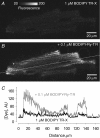
Spatial distribution of BODIPY TR-X ivermectin in permeabilized ventricular cells A and B, ventricular cell pretreated for 15 min with 1 μm BODIPY TR-X ivermectin before (A) and 15 min after (B) addition of 0.1 μm BTR to the bathing solution. Excitation/emission, 543/650 nm. C, the graph shows fluorescence profiles for A (black) and B (grey) taken as shown with dotted line in B.
Figure 8
Figure 8
Spatial distribution of spontaneous Ca2+ sparks in permeabilized ventricular cells A, to localize Ca2+ sparks, the permeabilized cells were pretreated with 0.1 μm BTR and fluo-3 (pentapotassium salt). The same area of a ventricular cell was visualized with excitation/emission, 488/505 nm (upper panel) or 543/650 nm (lower panel). Centres of spark lines found with fluo-3 were marked with circles on corresponding images in BTR as shown on lower panel. Yellow circles represent sparks from the A-band. B, representative image of cell showing distribution of spontaneous sparks in the zone of perinuclear mitochondria. Optical slice, < 1 μm. Note, the thickness of the slide permits mitochondria to be seen together with the surrounding SR. N, nucleus. C, the graph shows histogram of spark distribution as spark number against the distance from nearest Z-line.
Figure 9
Figure 9
Spontaneous Ca2+ sparks in different zones of permeabilized ventricular cells A, an example of localization of Ca2+ sparks. Ventricular cells were pretreated for 5 min with 0.1 μm Bodipy-TR-X ryanodine and visualized as an optical slice < 1 μm with excitation/emission, 543/560 nm in xy mode (left panel). Then one line was picked up on the image and scanned in xt mode with 1 ms interval with excitation/emission, 488/505 nm (right panel). Additionally, 10 000 repetitive line scans were made to mark a scanned line and locate it on the xy confocal image (dotted square on the left panel). During data analysis, recorded spontaneous Ca2+ sparks were localized on the line as shown and sorted according to distance from Z-line when its location was clearly seen. B, representative image of ventricular cell pretreated with 0.1 μm Bodipy-TR-X ryanodine and 25 μm fluo-3 (pentapotassium salt). Excitation/emission, 543/650 nm. C, Ca2+ sparks were collected in line-scan mode scanning lines as shown in B in perinuclear mitochondria (PNM) zone (blue line) and IMFM zone (yellow line). Representative spark images in C are shown with corresponding colour of frame. D, spatio-temporal characteristics of sparks located in T-tubule, A-band zone or in the zone of PNM. Duration and width of sparks were measured at half of amplitude. n = 9–67 as marked on bars. N, nucleus; PNM, perinuclear mitochondria; IMFM, intermyofibrillar mitochondrion.
Figure 10
Figure 10
Repetitive sparks in ventricular cells A, disproportionate activity of RyR2 clusters in ventricular cells. Centers of recorded sparks are marked with circles. Ca2+ sparks were recorded after pretreatment of permeabilized ventricular cells with 0.1 μm Bodipy-TR-X ryanodine and 25 μm fluo-3 (pentapotassium salt). Excitation/emission, 488/505 nm. Optical slice < 1 μm. B, distribution of shortest distances between repetitive sparks (n = 53). C, the diagram shows distribution of putative functional groups of RyR2s within a RyR2 cluster depending on their shape, square (set of black boxes) or round (red ring). Centres of spark mass are shown with red circles. Blue and black arrows show two points of view in Z direction depending on orientation of the cluster. Blue and black lines show corresponding distances between centres of mass.

Similar articles

Cited by

References

    1. Bers DM. Excitation-Contraction Coupling and Cardiac Contractile Force. Dordrecht, The Netherlands: Kluwer Academic Publishers; 2001.
    1. Bers DM. Macromolecular complexes regulating cardiac ryanodine receptor function. J Mol Cell Cardiol. 2004;37:417–429. - PubMed
    1. Bhat MB, Hayek SM, Zhao J, Zang W, Takeshima H, Wier WG, Ma J. Expression and functional characterization of the cardiac muscle ryanodine receptor Ca2+ release channel in Chinese hamster ovary cells. Biophys J. 1999;77:808–816. - PMC - PubMed
    1. Bilmen JG, Wootton LL, Michelangeli F. The inhibition of the sarcoplasmic/endoplasmic reticulum Ca2+-ATPase by macrocyclic lactones and cyclosporin A. Biochem J. 2002;366:255–263. - PMC - PubMed
    1. Bridge JH, Ershler PR, Cannell MB. Properties of Ca2+ sparks evoked by action potentials in mouse ventricular myocytes. J Physiol. 1999;518:469–478. - PMC - PubMed

Publication types

Substances

LinkOut - more resources