The use of evoked potentials in sleep research
- PMID: 17628317
- PMCID: PMC2704024
- DOI: 10.1016/j.smrv.2007.05.001
The use of evoked potentials in sleep research
Abstract
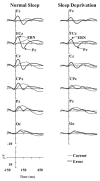
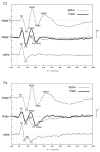
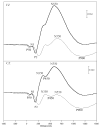
Averaged event-related potentials (ERPs) represent sensory and cognitive processing of stimuli during wakefulness independent of behavioral responses, and reflect the underlying state of the CNS (central nervous system) during sleep. Components measured during wakefulness which are reflective of arousal state or the automatic switching of attention are sensitive to prior sleep disruption. Components reflecting active attentional influences during the waking state appear to be preserved in a rudimentary form during REM sleep, but in a way that highlights the differences in the neurochemical environment between wakefulness and REM sleep. Certain ERP components only appear within sleep. These begin to emerge at NREM sleep onset and may reflect inhibition of information processing and thus have utility as markers of the functional status of sleep preparatory mechanisms. These large amplitude NREM components represent synchronized burst firing of large number of cortical cells and are a reflection of the nervous system's capacity to generate delta frequency EEG activity. As such they are useful in assessing the overall integrity of the nervous system in populations not showing substantial amounts of SWS as measured using traditional criteria. While requiring care in their interpretation, ERPs nonetheless provide a rich tool to investigators interested in probing the nervous system to evaluate daytime functioning in the face of sleep disruption, the ability of the sleeping nervous system to monitor the external environment, and the ability of the nervous system to respond to stimuli in a manner consistent with the initiation or maintenance of sleep.
Figures


Similar articles
-
Event-related potentials (ERPs) to deviant auditory stimuli during sleep and waking.Neuroreport. 1996 Apr 10;7(5):1082-6. doi: 10.1097/00001756-199604100-00026. Neuroreport. 1996. PMID: 8804056
-
Brain processing of stimulus deviance during slow-wave and paradoxical sleep: a study of human auditory evoked responses using the oddball paradigm.J Clin Neurophysiol. 1995 Mar;12(2):155-67. doi: 10.1097/00004691-199503000-00006. J Clin Neurophysiol. 1995. PMID: 7797630
-
Endogenous components of event-related potential appearing during NREM stage 1 and REM sleep in man.Int J Psychophysiol. 1994 Jul;17(2):165-74. doi: 10.1016/0167-8760(94)90032-9. Int J Psychophysiol. 1994. PMID: 7995779
-
Neuronal activities underlying the electroencephalogram and evoked potentials of sleeping and waking: implications for information processing.Neurosci Biobehav Rev. 1995 Fall;19(3):447-63. doi: 10.1016/0149-7634(95)00010-c. Neurosci Biobehav Rev. 1995. PMID: 7566746 Review.
-
ERPs studies of cognitive processing during sleep.Int J Psychol. 2009 Aug;44(4):290-304. doi: 10.1080/00207590802194234. Int J Psychol. 2009. PMID: 22029558 Review.
Cited by
-
Tobacco use is associated with reduced amplitude and intensity dependence of the cortical auditory evoked N1-P2 component.Psychopharmacology (Berl). 2016 Jun;233(11):2173-2183. doi: 10.1007/s00213-016-4268-z. Epub 2016 Mar 17. Psychopharmacology (Berl). 2016. PMID: 26983415
-
Sleep State Influences Early Sound Encoding at Cortical But Not Subcortical Levels.J Neurosci. 2025 Aug 6;45(32):e0368252025. doi: 10.1523/JNEUROSCI.0368-25.2025. J Neurosci. 2025. PMID: 40623839
-
An Investigation of the Effects of Brain Fatigue on the Sustained Attention of Intelligent Coal Mine VDT Operators.Int J Environ Res Public Health. 2022 Sep 3;19(17):11034. doi: 10.3390/ijerph191711034. Int J Environ Res Public Health. 2022. PMID: 36078749 Free PMC article.
-
The extent of processing of near-hearing threshold stimuli during natural sleep.Sleep. 2011 Sep 1;34(9):1243-9. doi: 10.5665/SLEEP.1248. Sleep. 2011. PMID: 21886362 Free PMC article.
-
Auditory responses and stimulus-specific adaptation in rat auditory cortex are preserved across NREM and REM sleep.Cereb Cortex. 2015 May;25(5):1362-78. doi: 10.1093/cercor/bht328. Epub 2013 Dec 8. Cereb Cortex. 2015. PMID: 24323498 Free PMC article.
References
-
- Regan DM. Human Brain Electrophysiology. New York: Elsevier; 1995.
-
- Nicholas CL, Trinder J, Crowley KE, et al. The impact of slow wave sleep proximity on evoked K-complex generation. Neurosci Lett. 2006;404(1–2):127–31. - PubMed
-
- Dinges DF, Kribbs NB. Performing while sleepy: effects of experimentally induced sleepiness. In: Monk TH, editor. Sleep, Sleepiness and Performance. Chichester, UK: John Wiley and Sons; 1991. pp. 98–128.
-
- Koslowsky M, Babkoff H. Meta-analysis of the relationship between total sleep deprivation and performance. Chronobiol Int. 1992;9(2):132–6. - PubMed
-
- Pilcher JJ, Huffcutt AI. Effects of sleep deprivation on performance: a meta-analysis. Sleep. 1996;19(4):318–26. - PubMed
Publication types
MeSH terms
Grants and funding
- R01 AA005965/AA/NIAAA NIH HHS/United States
- R01 DA016427/DA/NIDA NIH HHS/United States
- R37 AA005965/AA/NIAAA NIH HHS/United States
- AA12388/AA/NIAAA NIH HHS/United States
- R01 AA012388/AA/NIAAA NIH HHS/United States
- AA05965/AA/NIAAA NIH HHS/United States
- R21 AA017320/AA/NIAAA NIH HHS/United States
- DA16427/DA/NIDA NIH HHS/United States
- R01 HL058585/HL/NHLBI NIH HHS/United States
- R56 HL058585/HL/NHLBI NIH HHS/United States
- AA14211/AA/NIAAA NIH HHS/United States
- HL58585/HL/NHLBI NIH HHS/United States
- R01 AA014211/AA/NIAAA NIH HHS/United States
LinkOut - more resources
Full Text Sources
Other Literature Sources
Research Materials

