Review
. 2007;37 Suppl 1(Suppl 1):S120-34.
doi: 10.1016/j.neuroimage.2007.05.043. Epub 2007 Jun 7.

Predictive oncology: a review of multidisciplinary, multiscale in silico modeling linking phenotype, morphology and growth

Affiliations
Review

Predictive oncology: a review of multidisciplinary, multiscale in silico modeling linking phenotype, morphology and growth

Sandeep Sanga et al. Neuroimage. 2007.

Abstract

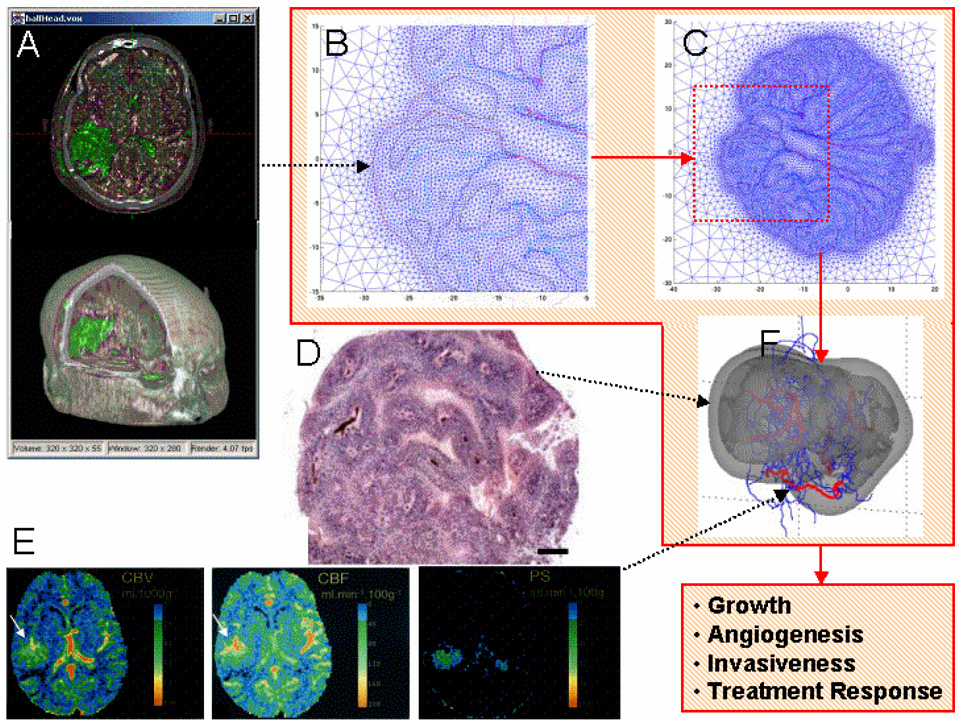
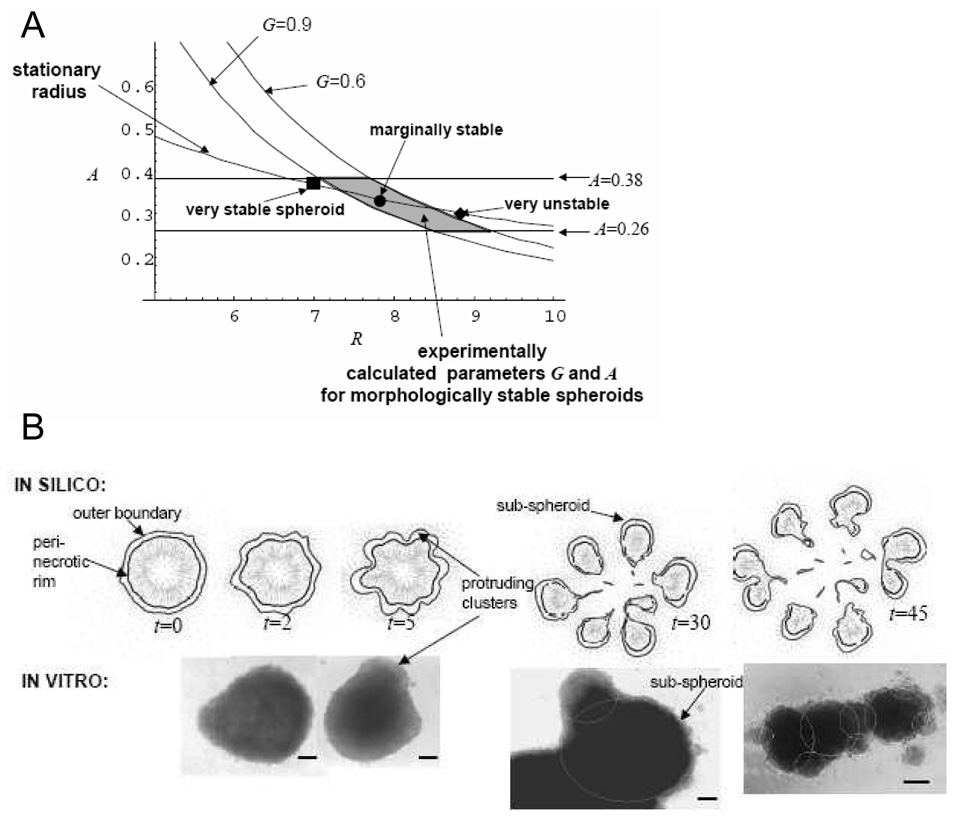
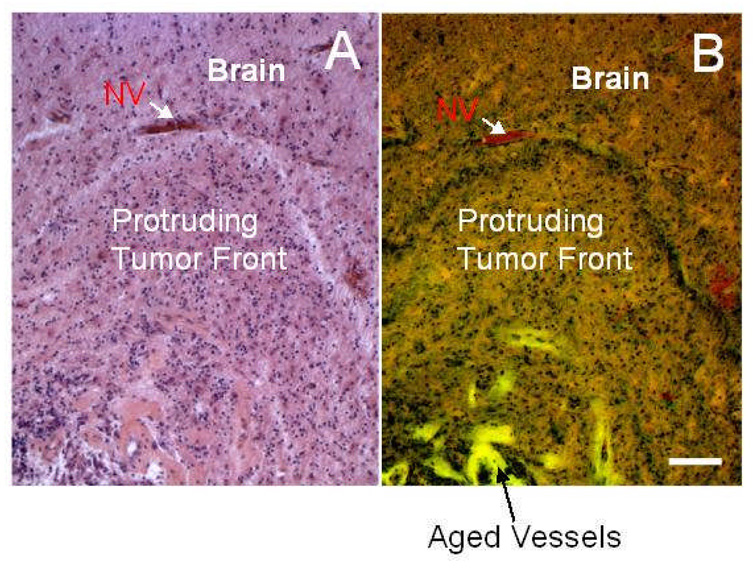
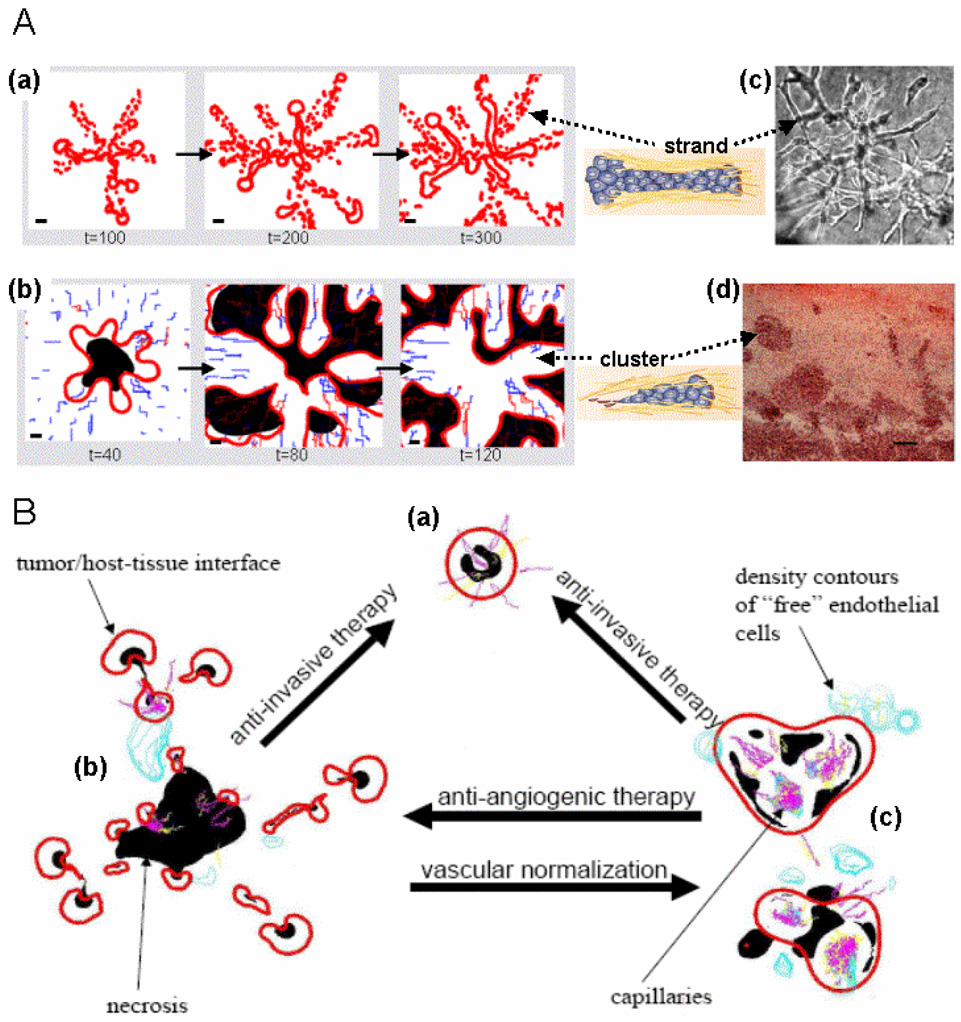
Empirical evidence and theoretical studies suggest that the phenotype, i.e., cellular- and molecular-scale dynamics, including proliferation rate and adhesiveness due to microenvironmental factors and gene expression that govern tumor growth and invasiveness, also determine gross tumor-scale morphology. It has been difficult to quantify the relative effect of these links on disease progression and prognosis using conventional clinical and experimental methods and observables. As a result, successful individualized treatment of highly malignant and invasive cancers, such as glioblastoma, via surgical resection and chemotherapy cannot be offered and outcomes are generally poor. What is needed is a deterministic, quantifiable method to enable understanding of the connections between phenotype and tumor morphology. Here, we critically assess advantages and disadvantages of recent computational modeling efforts (e.g., continuum, discrete, and cellular automata models) that have pursued this understanding. Based on this assessment, we review a multiscale, i.e., from the molecular to the gross tumor scale, mathematical and computational "first-principle" approach based on mass conservation and other physical laws, such as employed in reaction-diffusion systems. Model variables describe known characteristics of tumor behavior, and parameters and functional relationships across scales are informed from in vitro, in vivo and ex vivo biology. We review the feasibility of this methodology that, once coupled to tumor imaging and tumor biopsy or cell culture data, should enable prediction of tumor growth and therapy outcome through quantification of the relation between the underlying dynamics and morphological characteristics. In particular, morphologic stability analysis of this mathematical model reveals that tumor cell patterning at the tumor-host interface is regulated by cell proliferation, adhesion and other phenotypic characteristics: histopathology information of tumor boundary can be inputted to the mathematical model and used as a phenotype-diagnostic tool to predict collective and individual tumor cell invasion of surrounding tissue. This approach further provides a means to deterministically test effects of novel and hypothetical therapy strategies on tumor behavior.


Figures

Figure 1
Figure 1
Patient data can be inputted into an in-silico model of cancer. The red line encloses sample in-silico representations of tumor morphology. Tumor morphology at a given time is inputted from 3-D voxel fusion of CT and MR data (A) (reprinted with permission from Xie et al. (c) 2004 IEEE) that is translated voxel by voxel (using a computer program) into the in-silico coordinate system (B) (in this example, an unstructured adaptive mesh by Cristini et al., 2001) to build a tumor representation in virtual computational space (C). Spatial information of viable cell regions and vasculature structure is obtained from histophathology (D) (reprinted from NeuroImage, Frieboes et al., in press, Copyright 2007, with permission from Elsevier; bar, 200 µm). Vasculature specific information is defined from dynamic contrast enhanced CT (E), yielding parameters such as blood volume (left), blood flow (middle), and microvascular permeability (right) (reprinted with permission from Roberts et al., 2002). Other input data to the model include cell-scale parameters such as proliferation rates obtained, for example, from in vitro cultures. The model then predicts (F) tumor growth (viable cells: light gray; necrosis: darker gray), angiogenesis (red: mature; blue: immature capillaries), invasiveness, and response to treatment for this patient by solving time- and space-dependent conservation of mass and momentum and other physical laws (reprinted from NeuroImage, Frieboes et al., in press, Copyright 2007, with permission from Elsevier). These laws contain parameters that characterize the phenotypes and are linked to the underlying molecular biology by functional mathematical relationships founded on these and other experimental data. Incorporation of models of this biology (e.g., evolution of genotype, cell signaling pathways) guarantees that the in-silico predictions of tumor behavior are realistic and accurate. Computational solutions of this multi-scale model are obtained using finite elements and other numerical techniques.
Figure 2
Figure 2
Main component modules of a sample predictive model based on first principles (e.g., conservation laws of mass and momentum) linking cellular/molecular scale processes to tumor growth and morphology, assuming a tumor with two clones for simplicity. Each component (Vasculature, Tumor, Genotype) lists biological processes that are implemented through a set of equations (e.g., the diffusion-reaction equation determining the local concentration n of a cell substrate within the tumor), as well as suggested experiments for validation of these functional relationships. Additional biological processes, clones, and properties of the stroma can be incorporated by augmenting the number of variables and equations. Functional relationships to be determined experimentally describe mathematically the dependence of the listed phenotypic parameters (e.g., cell proliferation rates λM) on the array M that contains genetic information. Note that several of these parameters are phenomenological, i.e., they do not correspond to direct measurables (e.g., the “strengths” α of haptotaxis and chemotaxis, which are related to the expression of integrins and the mechanical forces exchanged with molecules in the ECM). Data obtained from in vitro experiments, in vivo / ex vivo models, and clinically (e.g., tumor size, morphology) is thus input to the various modules. This data will also help refine the model’s functional relationships through an iterative exercise of multidisciplinary research that will progressively lead, over the next decade, to less phenomenological and more “exact” models, in which the parameters are directly measurable in experiments. For further mathematical details and definitions of variables and parameters, and for demonstrations of a “prototype” in-silico model see Frieboes et al. (2007), Bearer and Cristini, MS submitted, and references therein.
Figure 2
Figure 2
Main component modules of a sample predictive model based on first principles (e.g., conservation laws of mass and momentum) linking cellular/molecular scale processes to tumor growth and morphology, assuming a tumor with two clones for simplicity. Each component (Vasculature, Tumor, Genotype) lists biological processes that are implemented through a set of equations (e.g., the diffusion-reaction equation determining the local concentration n of a cell substrate within the tumor), as well as suggested experiments for validation of these functional relationships. Additional biological processes, clones, and properties of the stroma can be incorporated by augmenting the number of variables and equations. Functional relationships to be determined experimentally describe mathematically the dependence of the listed phenotypic parameters (e.g., cell proliferation rates λM) on the array M that contains genetic information. Note that several of these parameters are phenomenological, i.e., they do not correspond to direct measurables (e.g., the “strengths” α of haptotaxis and chemotaxis, which are related to the expression of integrins and the mechanical forces exchanged with molecules in the ECM). Data obtained from in vitro experiments, in vivo / ex vivo models, and clinically (e.g., tumor size, morphology) is thus input to the various modules. This data will also help refine the model’s functional relationships through an iterative exercise of multidisciplinary research that will progressively lead, over the next decade, to less phenomenological and more “exact” models, in which the parameters are directly measurable in experiments. For further mathematical details and definitions of variables and parameters, and for demonstrations of a “prototype” in-silico model see Frieboes et al. (2007), Bearer and Cristini, MS submitted, and references therein.
Figure 3
Figure 3
Effects of tumor cell and environment heterogeneity on overall tumor morphology predicted by a number of “discrete” (each tumor cell’s position is “tracked” during a simulation) computational models recently introduced. Simulation results from Anderson (2005) show the importance of tumor cell-matrix interactions in aiding or hindering migration of individual cells thus defining the overall tumor-scale geometry (A and B). Tumor types I-IV correspond to cell phenotypes displaying increasing levels of aggressiveness, i.e., combinations of cell-cell adhesiveness, proliferation, degradation, and migration rates. Both simulations use the same parameter values with the exception of differing initial ECM conditions (i.e., different distributions of matrix molecules). In (A), the matrix environment is initially described as homogeneous, whereas it is heterogeneous in (B). Consequently, (B) depicts invasive, fingering morphology. Cells of phenotype IV are on the tumor-host boundary, promoting invasion into host tissue, emphasizing that more aggressive cells drive fingering morphologies. These aggressive cells have minimal cell-cell adhesion, thus they do not tend to form compact structures. Simulations are carried out on a 400 × 400 grid representing 1 cm² of a virtual, 2-D tumor. Adapted from Anderson, A.R.A, A hybrid mathematical model of solid tumour invasion: the importance of cell adhesion, Mathematical Medicine and Biology, 2005, vol. 22, issue 2, pages 175–176, by permission of Oxford University Press. Simulation results from dos Reis et al. (2003) showing how tumors growing in host tissue environments of low (C) and high (D) “rigidity” can influence compact, non-invasive (C) and fractal, fingering, invasive (D) morphologies. Simulations are carried out to approximately 5000 cells, where cells are represented as interacting particles in a 2-D continuous space with periodic boundary conditions. Reprinted from Physica A, vol. 322, dos Reis et al., The interplay between cell adhesion and environment rigidity in the morphology of tumors, page 550, Copyright 2003, with permission from Elsevier. Cell patterns simulated using the model of Ferreira et al. (2002) (E) suggest how parameters characterizing cancer cells’ response to nutrient concentrations and embodying complex genetic and metabolic processes can influence the formation of fractal, fingering tumor morphologies. For comparison, a real fractal pattern observed in trichoblastoma (F). Reprinted figure with permission from Ferreira et al., Physical Review E, 65, page 021907-6, 2002. Copyright 2002 by the American Physical Society.
Figure 4
Figure 4
In-silico model predictions and in-vitro measurements of locally invasive cell clusters in collective migration, using a “continuum model” (see text for a definition). Adapted from Frieboes et al. (2006a) with permission from the American Association of Cancer Research. In the morphologic stability diagram (A), obtained from a mathematical analysis of the model, “stationary radius” describes tumor dimension R (unit length = 100 µm), monotonically decreasing as death (described by the parameter A) increases. The G-curves calculated by the mathematical model divide, for each value of G (a parameter related to cell adhesion), the parameter space into morphologically stable (left) and unstable (right) tumors. Stable tumors remain roughly spherical during growth; unstable tumors are invasive and form wavy protrusions at the tumor-host boundary that further develop into sub-tumors that break-up from the parent tumor (B). The shaded region was determined from calibration of the parameter values under “stable” in vitro conditions. Representative “stable” and “unstable” spheroids (filled symbols) from different sets of experiments are shown to agree with the model predictions. This means that the mathematical model was capable of predicting invasive behavior of tumors under conditions of growth factors and substrate concentrations different from the “control” that was used to calibrate the model parameters. These results indicate that wavy patterns of cell arrangements at the tumor-host boundary could be inputted to a mathematical model to predict future invasive potential. (B) Time progression (arbitrary units) of avascular glioma predicted by simulations of the in-silico model (top) compared to observations in vitro (bottom). Tumor morphology and invasiveness are predicted to be heavily influenced by substrate gradients (e.g., nutrient) in the cellular microenvironment, driving detachment of bulbs or clusters of cells. Bar, 130 µm.
Figure 5
Figure 5
Glioblastoma histopathological sections from one patient stained for H&E and viewed by bright field (A) and fluorescence (B) microscopy (Frieboes et al. 2007, reproduced with permission from Elsevier) showing tumor (bottom) pushing into more normal brain (top). Note demarcated margin between tumor and brain parenchyma to the middle top of the image and green fluorescent outlines of large vascular channels deeper in the tumor. Neovascularization (NV) at the tumor-brain interface can be detected by red fluorescence from the erythrocytes inside the vessels. Altogether, these data support our “morphologic instability” hypothesis. Bar, 100 µm.
Figure 6
Figure 6
In-silico predictions of tumor morphology based on varying cellular and micro-environmental conditions in a parameter-sensitivity simulation study of the continuum model by Zheng et al. 2005 (figures are not to scale). These results extend the findings illustrated in Figure 4 and demonstrate that the in-silico model can account for the variety of invasive morphologies observed in tumors, and that the in-silico model is thus potentially predictive of tumor growth. (A) When cell taxis but not proliferation is present, cells are predicted to align in chains or strands (a). When cell proliferation is significant, more bulb- or cluster-like protrusions form and detach into the host (b). Red: tumor boundary; Black: hypoxia; Blue and Pink: neovascularization (immature and mature, respectively); time units are arbitrary. Drawings of cell strand and cluster adapted by permission from Macmillan Publishers Ltd: Nature Rev. Cancer, Vol. 3, p. 366, Friedl & Wolf, Copyright 2003. Corresponding structures observed after inducing hypoxia in vitro (proliferation was also inhibited) (c) (Pennacchietti et al., 2003) and in vivo (Rubenstein et al., 2000) through anti-angiogenic therapy (d) are shown for comparison. Bar, 80 µm. Reprinted from Cancer Cell, Vol. 3, Pennacchietti et al., page 354, Copyright (2003), with permission from Elsevier. Reprinted from Neoplasia, vol. 2, Rubenstein et al., page 311, Copyright 2000, with permission from Neoplasia Press. (B) Snapshots from three simulated tumor morphologies corresponding to different values of cell adhesion and vascularization parameters: high cell adhesion (a); low cell adhesion (b); low cell adhesion and with higher microvascular density or more efficient vascularization (c). Arrows indicate morphology transitions following different therapy strategies. Adapted from Cristini et al. (2005) with permission from the American Association of Cancer Research.
Figure 7
Figure 7
Tumor biology revealed by parameter-sensitivity studies of a continuum FCCMU computer model is listed under the categories of Tumor, Microenvironment, Treatment Response, and Vasculature. (A) Gross tumor growth and morphology in 3-D are predicted based on cell-scale parameters (e.g., proliferation, cell adhesion) set from experimental values. Viable (light grey) and necrotic (dark grey) tissue as well as extensive vascularization (conducting vessels in red, non-conducting in blue) are shown. Reprinted from NeuroImage, Frieboes et al., in press, Copyright 2007, with permission from Elsevier. (B) Gradients of cell substrates (from highest (red) to lowest concentration (blue)) are predicted from the vasculature topology (dark red lines). Thin dashed line denotes tumor boundary. Reprinted from Journal of Mathematical Biology, Sinek et al., in press, Copyright 2007 Springer. With kind permission of Springer Science and Business Media. (C) Local tumor fragmentation (top) is predicted in response to chemotherapy involving large nanoparticles and adjuvant anti-angiogenesis (bottom). Boundary of tumor fragments is in red, vessels are pink (conducting) and light blue (non-conducting). Gradient of drug (red, highest, blue, lowest) is centered in middle area of tumor tissue. Adapted from Biomedical Microdevices, Vol 6, 2004, p. 307, Sinek et al., Figure 5. Copyright 2004 Kluwer Academic Publishers. With kind permission of Springer Science and Business Media. (D) Abnormal tumor vasculature architecture with conducting (red) and nonconducting vessels (blue) is predicted based on angiogenic regulators produced by tumor and host tissue. Reprinted from NeuroImage, Frieboes et al., in press, Copyright 2007, with permission from Elsevier.

References

    1. Adam J. General aspects of modeling tumor growth and the immune response. In: Adam J, Bellomo N, editors. A survey of models on tumor immune systems dynamics. Boston: Birkhauser; 1996. pp. 15–87.
    1. Ambrosi D, Guana F. Stress-modulated growth. Math. Meth. Solids. 2006 in press.
    1. Ambrosi D, Preziosi L. On the closure of mass balance models for tumor growth. Math. Mod. Meth. Appl. Sci. 2002;12:737–754.
    1. Anderson ARA, Chaplain MAJ. Continuous and discrete models of tumour-induced angiogenesis. Bull. Math. Biol. 1998;60:857–899. - PubMed
    1. Anderson ARA, Chaplain MAJ, Newman EL, Steele RJC, Thompson AM. Mathematical modeling of tumour invasion and metastasis. J. Theor. Med. 2000;2:129–154.

Publication types