

Compression-based classification of biological sequences and structures via the Universal Similarity Metric: experimental assessment
- PMID: 17629909
- PMCID: PMC1939857
- DOI: 10.1186/1471-2105-8-252
Compression-based classification of biological sequences and structures via the Universal Similarity Metric: experimental assessment
Abstract
Background: Similarity of sequences is a key mathematical notion for Classification and Phylogenetic studies in Biology. It is currently primarily handled using alignments. However, the alignment methods seem inadequate for post-genomic studies since they do not scale well with data set size and they seem to be confined only to genomic and proteomic sequences. Therefore, alignment-free similarity measures are actively pursued. Among those, USM (Universal Similarity Metric) has gained prominence. It is based on the deep theory of Kolmogorov Complexity and universality is its most novel striking feature. Since it can only be approximated via data compression, USM is a methodology rather than a formula quantifying the similarity of two strings. Three approximations of USM are available, namely UCD (Universal Compression Dissimilarity), NCD (Normalized Compression Dissimilarity) and CD (Compression Dissimilarity). Their applicability and robustness is tested on various data sets yielding a first massive quantitative estimate that the USM methodology and its approximations are of value. Despite the rich theory developed around USM, its experimental assessment has limitations: only a few data compressors have been tested in conjunction with USM and mostly at a qualitative level, no comparison among UCD, NCD and CD is available and no comparison of USM with existing methods, both based on alignments and not, seems to be available.
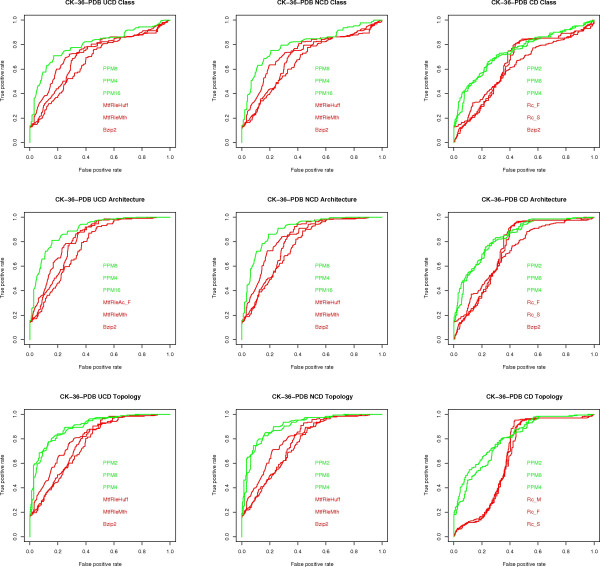
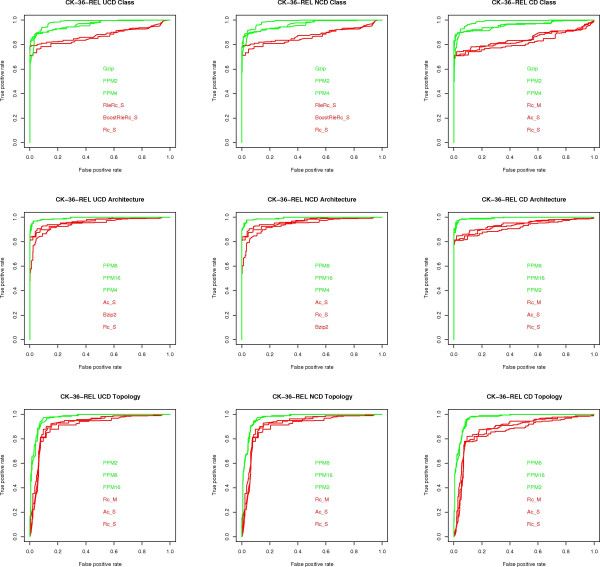
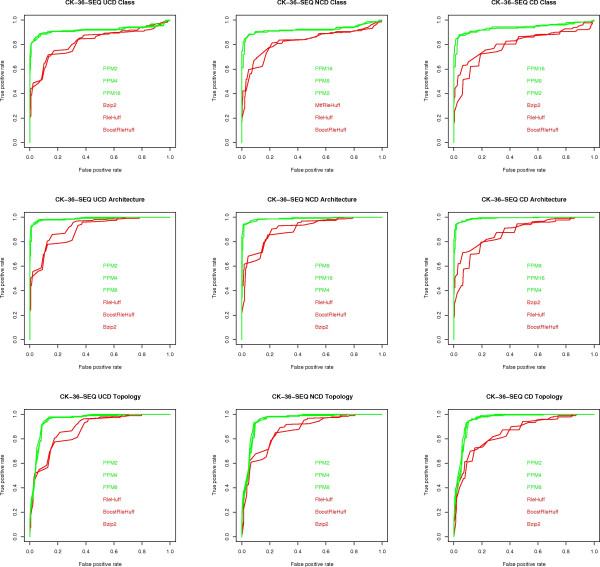
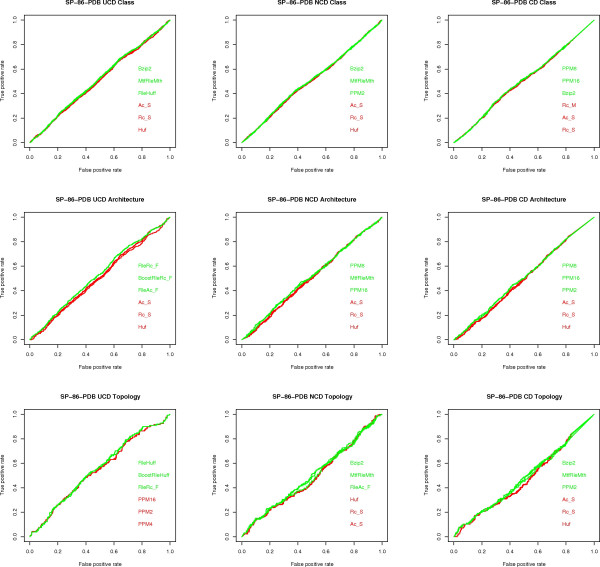
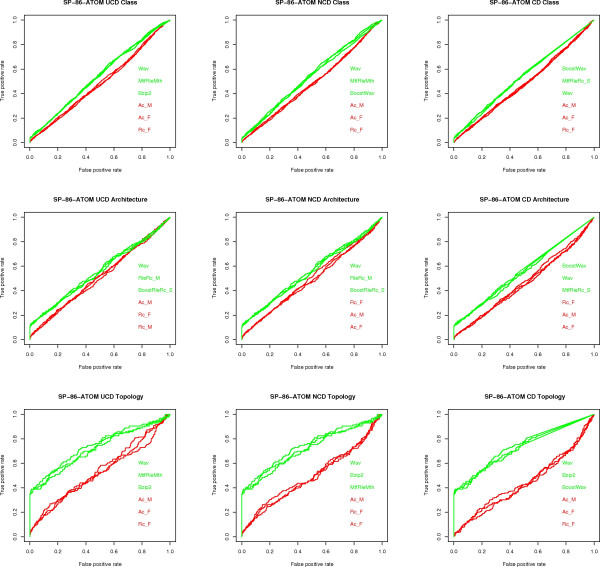
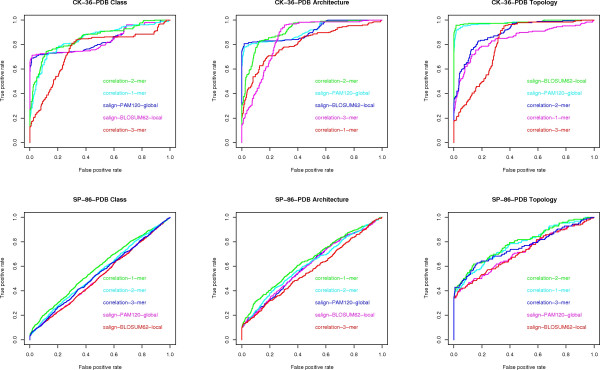
Results: We experimentally test the USM methodology by using 25 compressors, all three of its known approximations and six data sets of relevance to Molecular Biology. This offers the first systematic and quantitative experimental assessment of this methodology, that naturally complements the many theoretical and the preliminary experimental results available. Moreover, we compare the USM methodology both with methods based on alignments and not. We may group our experiments into two sets. The first one, performed via ROC (Receiver Operating Curve) analysis, aims at assessing the intrinsic ability of the methodology to discriminate and classify biological sequences and structures. A second set of experiments aims at assessing how well two commonly available classification algorithms, UPGMA (Unweighted Pair Group Method with Arithmetic Mean) and NJ (Neighbor Joining), can use the methodology to perform their task, their performance being evaluated against gold standards and with the use of well known statistical indexes, i.e., the F-measure and the partition distance. Based on the experiments, several conclusions can be drawn and, from them, novel valuable guidelines for the use of USM on biological data. The main ones are reported next.
Conclusion: UCD and NCD are indistinguishable, i.e., they yield nearly the same values of the statistical indexes we have used, accross experiments and data sets, while CD is almost always worse than both. UPGMA seems to yield better classification results with respect to NJ, i.e., better values of the statistical indexes (10% difference or above), on a substantial fraction of experiments, compressors and USM approximation choices. The compression program PPMd, based on PPM (Prediction by Partial Matching), for generic data and Gencompress for DNA, are the best performers among the compression algorithms we have used, although the difference in performance, as measured by statistical indexes, between them and the other algorithms depends critically on the data set and may not be as large as expected. PPMd used with UCD or NCD and UPGMA, on sequence data is very close, although worse, in performance with the alignment methods (less than 2% difference on the F-measure). Yet, it scales well with data set size and it can work on data other than sequences. In summary, our quantitative analysis naturally complements the rich theory behind USM and supports the conclusion that the methodology is worth using because of its robustness, flexibility, scalability, and competitiveness with existing techniques. In particular, the methodology applies to all biological data in textual format. The software and data sets are available under the GNU GPL at the supplementary material web page.
Figures
Similar articles
-
Comparison study on k-word statistical measures for protein: from sequence to 'sequence space'.BMC Bioinformatics. 2008 Sep 23;9:394. doi: 10.1186/1471-2105-9-394. BMC Bioinformatics. 2008. PMID: 18811946 Free PMC article.
-
Protein multiple sequence alignment benchmarking through secondary structure prediction.Bioinformatics. 2017 May 1;33(9):1331-1337. doi: 10.1093/bioinformatics/btw840. Bioinformatics. 2017. PMID: 28093407 Free PMC article.
-
On the quality of tree-based protein classification.Bioinformatics. 2005 May 1;21(9):1876-90. doi: 10.1093/bioinformatics/bti244. Epub 2005 Jan 12. Bioinformatics. 2005. PMID: 15647305
-
ROC analysis: applications to the classification of biological sequences and 3D structures.Brief Bioinform. 2008 May;9(3):198-209. doi: 10.1093/bib/bbm064. Epub 2008 Jan 11. Brief Bioinform. 2008. PMID: 18192302 Review.
-
Comparison of proteins based on segments structural similarity.Acta Biochim Pol. 2004;51(1):161-72. Acta Biochim Pol. 2004. PMID: 15094837 Review.
Cited by
-
Using Recursive Feature Selection with Random Forest to Improve Protein Structural Class Prediction for Low-Similarity Sequences.Comput Math Methods Med. 2021 May 7;2021:5529389. doi: 10.1155/2021/5529389. eCollection 2021. Comput Math Methods Med. 2021. PMID: 34055035 Free PMC article.
-
Data compression for sequencing data.Algorithms Mol Biol. 2013 Nov 18;8(1):25. doi: 10.1186/1748-7188-8-25. Algorithms Mol Biol. 2013. PMID: 24252160 Free PMC article.
-
Information Theory Opens New Dimensions in Experimental Studies of Animal Behaviour and Communication.Animals (Basel). 2023 Mar 26;13(7):1174. doi: 10.3390/ani13071174. Animals (Basel). 2023. PMID: 37048430 Free PMC article. Review.
-
Comparison of Compression-Based Measures with Application to the Evolution of Primate Genomes.Entropy (Basel). 2018 May 23;20(6):393. doi: 10.3390/e20060393. Entropy (Basel). 2018. PMID: 33265483 Free PMC article.
-
Comparison study on statistical features of predicted secondary structures for protein structural class prediction: From content to position.BMC Bioinformatics. 2013 May 4;14:152. doi: 10.1186/1471-2105-14-152. BMC Bioinformatics. 2013. PMID: 23641706 Free PMC article.
References
-
- Kolmogorov Library Supplementary Material Web Page http://www.math.unipa.it/~raffaele/kolmogorov/
-
- Kruskal J, Sankoff D, (Eds) Time Wraps, String Edits, and Macromolecules: The Theory and Practice of Sequence Comparison. Addison-Wesley; 1983.
-
- Waterman M. Introduction to Computational Biology Maps, Sequences and Genomes. Chapman Hall; 1995.
-
- Gusfield D. Algorithms on Strings, Trees, and Sequences: Computer Science and Computational Biology. Cambridge University Press; 1997.
-
- Vinga S, Almeida J. Alignment-Free Sequence Comparison: A Review. Bioinformatics. 2003;19:513–523. - PubMed
Publication types
MeSH terms
Substances
LinkOut - more resources
Full Text Sources
