

Patterns of genetic variation in populations of infectious agents
- PMID: 17629913
- PMCID: PMC1949404
- DOI: 10.1186/1471-2148-7-116
Patterns of genetic variation in populations of infectious agents
Abstract
Background: The analysis of genetic variation in populations of infectious agents may help us understand their epidemiology and evolution. Here we study a model for assessing the levels and patterns of genetic diversity in populations of infectious agents. The population is structured into many small subpopulations, which correspond to their hosts, that are connected according to a specific type of contact network. We considered different types of networks, including fully connected networks and scale free networks, which have been considered as a model that captures some properties of real contact networks. Infectious agents transmit between hosts, through migration, where they grow and mutate until elimination by the host immune system.
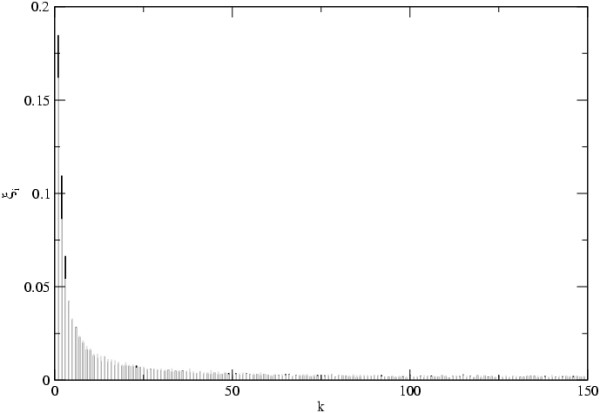
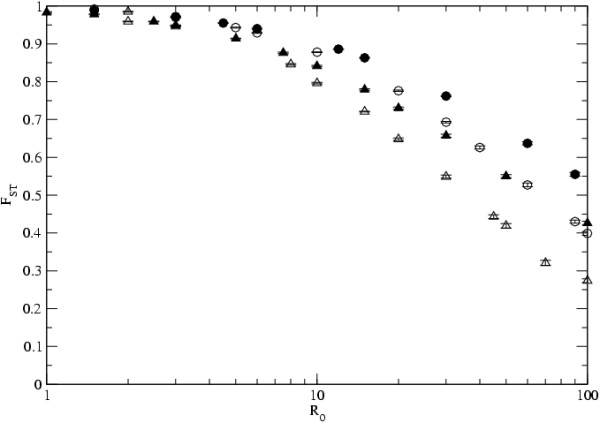
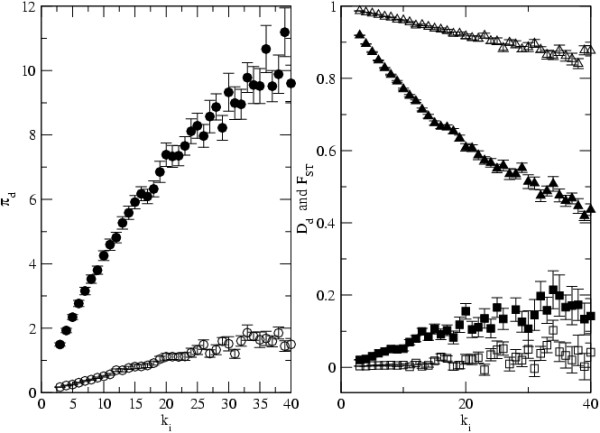
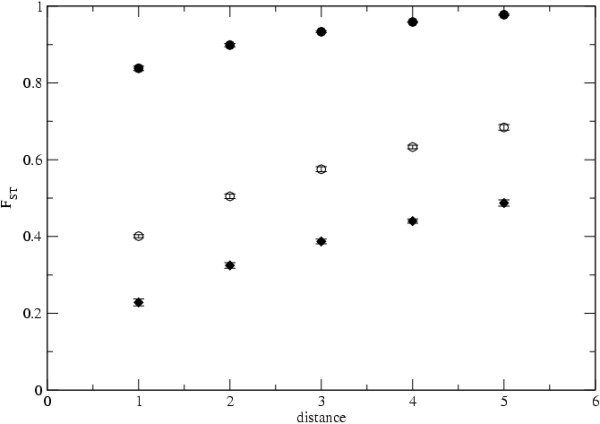
Results: We show how our model is closely related to the classical SIS model in epidemiology and find that: depending on the relation between the rate at which infectious agents are eliminated by the immune system and the within host effective population size, genetic diversity increases with R0 or peaks at intermediate R0 levels; patterns of genetic diversity in this model are in general similar to those expected under the standard neutral model, but in a scale free network and for low values of R0 a distortion in the neutral mutation frequency spectrum can be observed; highly connected hosts (hubs in the network) show patterns of diversity different from poorly connected individuals, namely higher levels of genetic variation, lower levels of genetic differentiation and larger values of Tajima's D.
Conclusion: We have found that levels of genetic variability in the population of infectious agents can be predicted by simple analytical approximations, and exhibit two distinct scenarios which are met according to the relation between the rate of drift and the rate at which infectious agents are eliminated. In one scenario the diversity is an increasing function of the level of transmission and in a second scenario it is peaked around intermediate levels of transmission. This is independent of the type of host contact structure. Furthermore for low values of R0, very heterogeneous host contact structures lead to lower levels of diversity.
Figures
Similar articles
-
The effect of host genetic diversity on disease spread.Am Nat. 2010 Jun;175(6):E149-52. doi: 10.1086/652430. Am Nat. 2010. PMID: 20388005
-
Population structure and the co-evolution between social parasites and their hosts.Mol Ecol. 2007 May;16(10):2063-78. doi: 10.1111/j.1365-294X.2007.03300.x. Mol Ecol. 2007. PMID: 17498232
-
More than meets the eye: detecting cryptic microgeographic population structure in a parasite with a complex life cycle.Mol Ecol. 2011 Jun;20(12):2510-24. doi: 10.1111/j.1365-294X.2011.05113.x. Epub 2011 May 3. Mol Ecol. 2011. PMID: 21535278
-
The landscape genetics of infectious disease emergence and spread.Mol Ecol. 2010 Sep;19(17):3515-31. doi: 10.1111/j.1365-294X.2010.04679.x. Epub 2010 Jul 7. Mol Ecol. 2010. PMID: 20618897 Free PMC article. Review.
-
Ecological feedbacks and the evolution of resistance.J Anim Ecol. 2009 Nov;78(6):1106-12. doi: 10.1111/j.1365-2656.2009.01568.x. Epub 2009 May 28. J Anim Ecol. 2009. PMID: 19490378 Review.
Cited by
-
Genetic diversity in the SIR model of pathogen evolution.PLoS One. 2009;4(3):e4876. doi: 10.1371/journal.pone.0004876. Epub 2009 Mar 16. PLoS One. 2009. PMID: 19287490 Free PMC article.
-
Understanding underlying physical mechanism reveals early warning indicators and key elements for adaptive infections disease networks.PNAS Nexus. 2024 Jun 26;3(7):pgae237. doi: 10.1093/pnasnexus/pgae237. eCollection 2024 Jul. PNAS Nexus. 2024. PMID: 39035039 Free PMC article.
-
Phylogenetic and epidemic modeling of rapidly evolving infectious diseases.Infect Genet Evol. 2011 Dec;11(8):1825-41. doi: 10.1016/j.meegid.2011.08.005. Epub 2011 Aug 31. Infect Genet Evol. 2011. PMID: 21906695 Free PMC article. Review.
-
Expansion of genetic diversity in randomly mating founder populations of Alternaria brassicicola infecting Cakile maritima in Australia.Appl Environ Microbiol. 2010 Mar;76(6):1946-54. doi: 10.1128/AEM.01594-09. Epub 2010 Jan 22. Appl Environ Microbiol. 2010. PMID: 20097819 Free PMC article.
-
SCOTTI: Efficient Reconstruction of Transmission within Outbreaks with the Structured Coalescent.PLoS Comput Biol. 2016 Sep 28;12(9):e1005130. doi: 10.1371/journal.pcbi.1005130. eCollection 2016 Sep. PLoS Comput Biol. 2016. PMID: 27681228 Free PMC article.
References
-
- Connway D, Cavanagh D, Tanabe K, Roper C, Mikes Z, Sakihama N, Bojang K, Oduola A, Kremsner P, Arnot D, Greenwood B, McBride J. A principal target of human immunity to malaria identified by molecular population genetics and immunological analyses. Nature Medicine. 2000;6:689–692. doi: 10.1038/76272. - DOI - PubMed
-
- Falush D, Wirth T, Linz B, Pritchard J, Stephens M, Kidd M, Blaser M, Graham D, Vacher S, Perez-Perez G, Yamaoka Y, Megraud F, Otto K, Reichard U, Katzowitsch E, Wang X, Achtman M, Suerbaum S. Traces of human migrations in Helicobacter pylori populations. Science. 2003;299:1582–1585. doi: 10.1126/science.1080857. - DOI - PubMed
Publication types
MeSH terms
LinkOut - more resources
Full Text Sources
Miscellaneous
